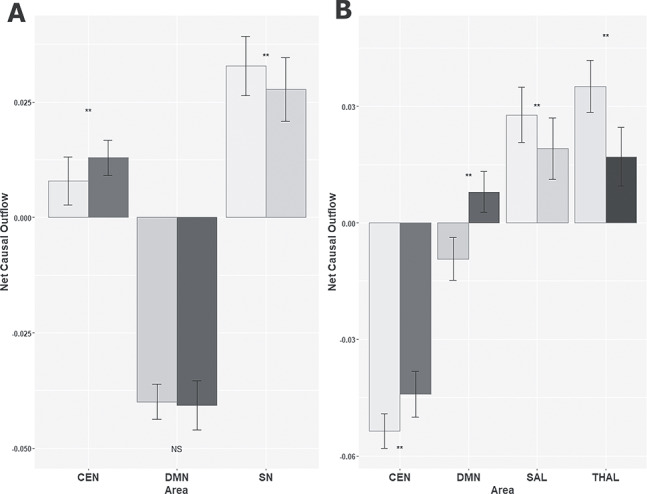
Figure 8.

Weighted net causal outflow for between-network directed functional connectivity analysis. (A) Weighted net causal outflow in three RSN. (B) Weighted net causal outflow in three RSN and the thalamus. Weighted net causal outflows were significantly different in few nodes in each of the three RSN young and elderly group (P < 0.01 is indicated by “**,” no significant difference is indicated by “NS”).
