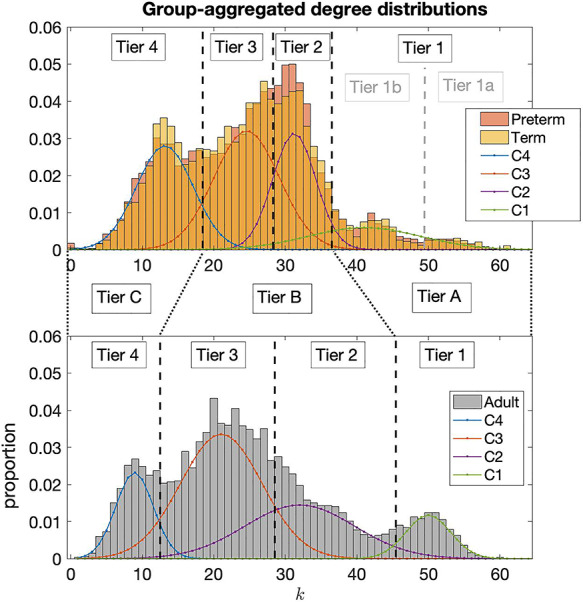
Figure 3.

Aggregated degree distributions of neonatal groups, top, and the adult group, bottom. Four distinct peaks are noted in the degree distributions of neonatal connectomes and corresponding peaks are also seen in the adult connectomes. The four Gaussian Mixture Model components are shown as C4, C3, C2, and C1. These are taken as the natural tiers of the connectomes and black dotted lines indicate the thresholds between tiers. Greater consistency between neonates and adults is found by consolidating the tiers as indicated by Tier A, B, and C.
