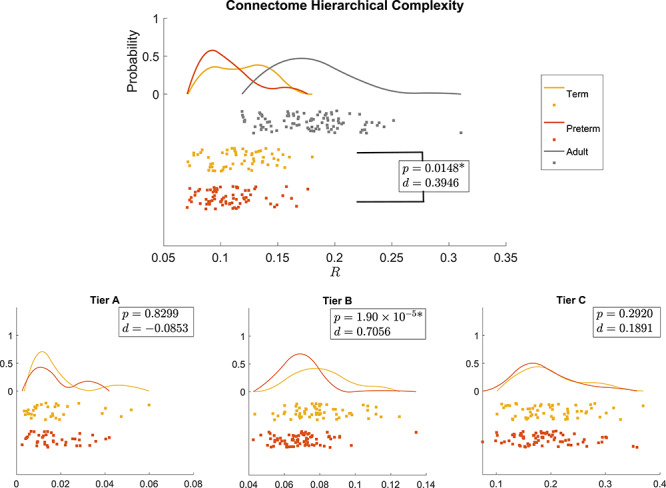
Figure 5.

Distribution of the global hierarchical complexity ( ) for the three populations as rain cloud plots (top) and hierarchical complexity of the three tiers in neonatal populations (bottom). Wilcoxon rank sum
  -values and Cohen’s
  values are shown for preterm versus term (all) and term versus adult (top). *Denotes significant difference after FDR correction.
