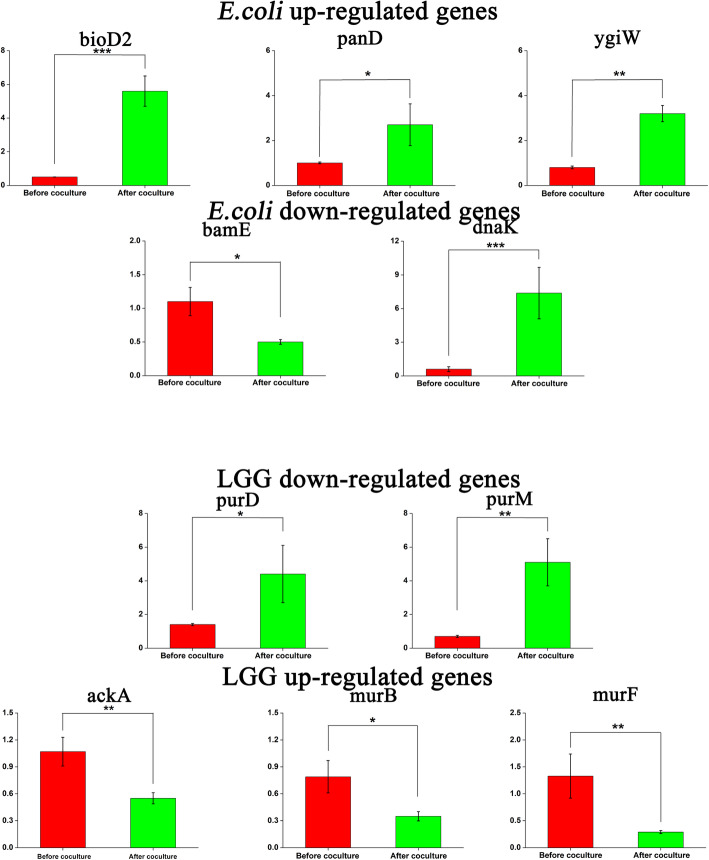
Fig. 5.
Relative mRNA expression of selected targets from global proteomics analysis. Total RNA isolated from coculture treatment or pure culture of E. coli and LGG was reversed transcribed and cDNA was quantified by qRT-PCR using target-specific primers. The data represents the mean ± SD of triplicate experiments normalised to 16S RNA. Statistically significant differences between coculture treatment and pure culture treatment, as determined by Student’s t-test analysis (unpaired, two-tailed), are represented as *p ≤ 0.5, **p ≤ 0.1 and ***p ≤ 0.01

