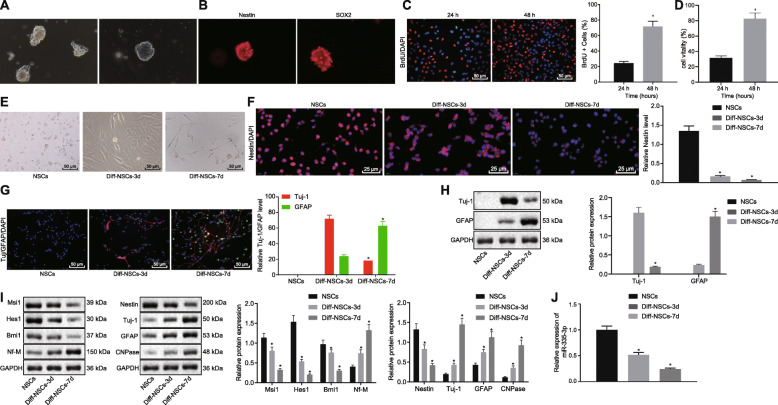
Fig. 1.
Downregulation of miR-335-3p was found during NSCs differentiation. a Microscopic views of neurosphere formed by the in vitro subculture of NSCs. b Nestin and SOX2 expression (red) in neurosphere detected by immunofluorescence assay. c NSC proliferation activity determined using BrdU assay (× 200). d The cell viability of NSCs assessed by CCK-8 assay. e NSC morphology after induced-differentiation observed on days 0, 3, and 7 (× 200). f Nestin expression (red) in NSCs after induced-differentiation measured using immunofluorescence assay on days 0, 3, and 7 (× 400). g Tuj-1 and GFAP expression in NSCs after induced-differentiation examined by immunofluorescence assay on days 0, 3, and 7 (× 200). h Western blot analysis for the expression of Tuj-1 and GFAP in NSCs after induced-differentiation on day 0, 3, and 7. i Western blot analysis of expression of Msi1, Hesl, Bmi1, Nf-M, Nestin, Tuj-1, GFAP, and CNPase in NSCs. j Expression of miR-335-3p assayed by RT-qPCR in NSCs after induced-differentiation on days 0, 3, and 7. The data in c and d were enumeration data, while the data in f–h were measurement data described as mean ± standard deviation. Unpaired t test was used for the comparison between two groups, while one-way ANOVA was employed for the analysis data among multiple groups, followed by Tukey’s post hoc test. *p < 0.05 versus NSCs without any induced-differentiation treatment or NSCs with induced-differentiation treatment at 24 h. The experiment was repeated in triplicate

