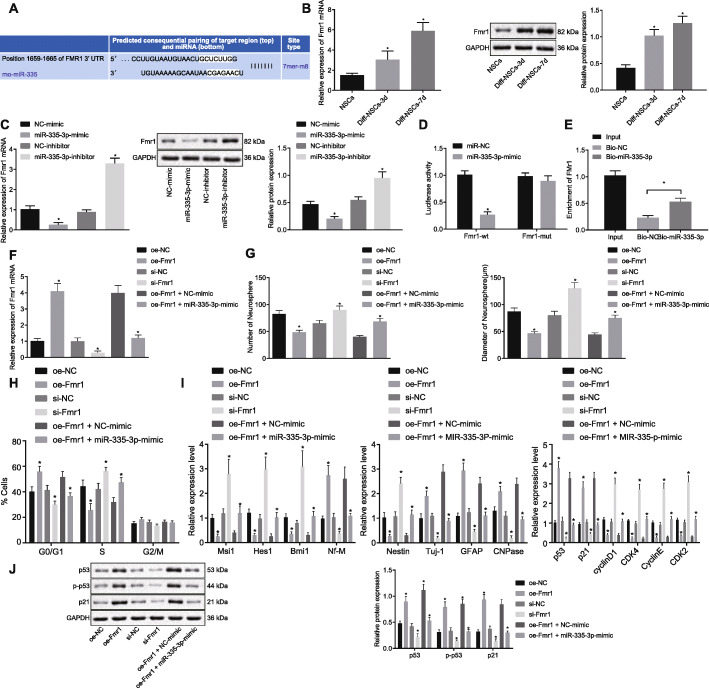
Fig. 5.
miR-335-3p inactivated p53 signaling pathway, repressed NSC differentiation, and promoted NSC self-renewal by targeting Fmr1. a The binding sites between miR-335-3p and Fmr1 3′-UTR predicted by bioinformatics analysis. b Fmr1 expression in NSCs after induced differentiation detected on days 0, 3, and 7 by RT-qPCR and Western blot analysis. c Fmr1 expression determined after alteration of miR-335-3p in NSCs using RT-qPCR and Western blot analysis. d Interaction between miR-335-3p and Fmr1 verified using dual-luciferase reporter assay. e The binding relationship between miR-335-3p and Fmr1 attested by RNA pull-down. f Fmr1 expression in NSCs after overexpression of miR-335-3p and Fmr1 measured by RT-qPCR and Western blot analysis. NSCs were treated with oe-NC, oe-Fmr1, si-NC, si-Fmr1, oe-Fmr1 + NC-mimic, and oe-Fmr1 + miR-335-3p mimic. g The quantitative analysis for number and size of neurospheres. h NSC cell cycle assayed by flow cytometry. i The expression of self-renewal-, differentiation-, and p53 signaling pathway-related genes in NSCs measured by RT-qPCR. j The protein level of self-renewal-, differentiation-, and p53 signaling pathway-related genes (p53, p21) in NSCs determined by Western blot analysis. The data were measurement data. Unpaired t test was employed to analyze the difference between two groups, while differences among multiple groups were analyzed using one-way ANOVA, with Tukey’s post hoc test. The statistical results were described as mean ± standard deviation. *p < 0.05 versus NSCs without any induced-differentiation treatment, NSCs treated with oe-NC, si-NC, or oe-Fmr1 + oe-NC. The experiment was performed three times

