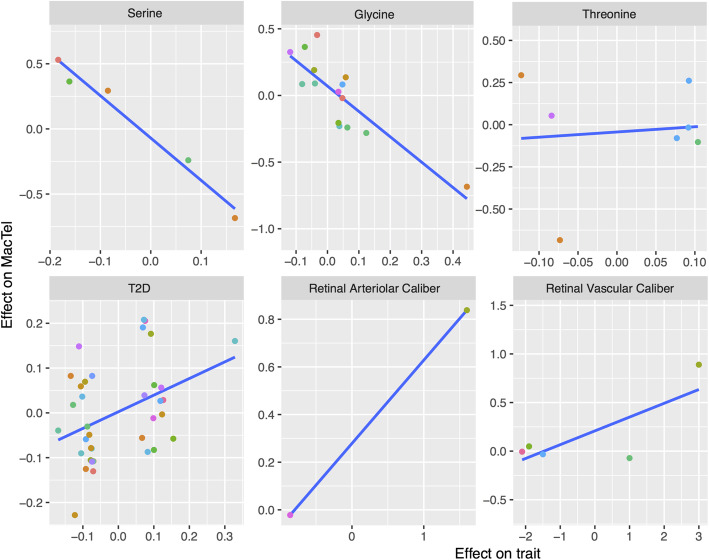
Fig. 2.
Effect size comparisons between MacTel and specific trait of SNPs used to define mPRS and tPRS. Each dot represents a SNP. Each panel represents a trait and contains the SNPs that were found to have a genome-wide significant effect on that trait. The x-axis captures the effect sizes of the SNPs on the trait while the y-axis captures the effect of the same SNPs on MacTel risk. The blue line represents a simple regression line between the two. Metabolites or traits causally affecting the disease are expected to have correlated effect sizes. Colour of the dots represents chromosomal positions where different chromosomes are represented by different colours

