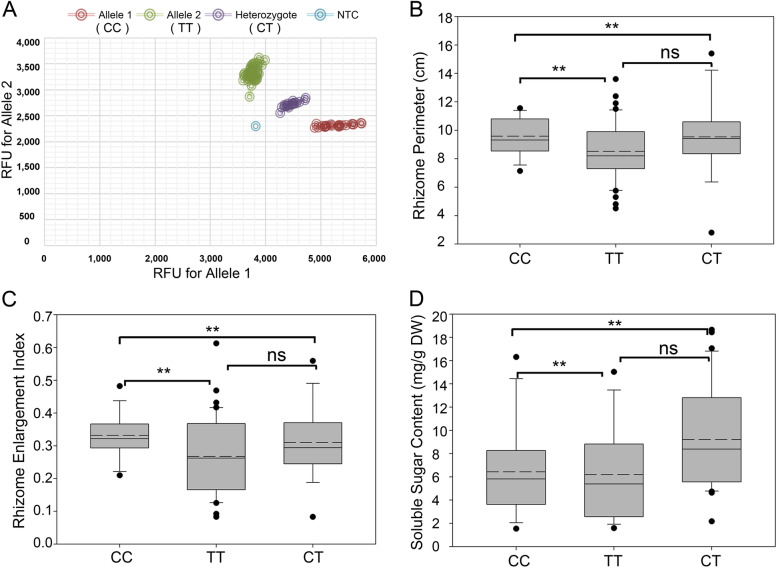
Fig. 4.
The SNP genotype results and the difference of lotus varieties rhizome traits between three groups with different SNP alterations. a SNP genotyping of target single nucleotide. KASP assay showing clustering of lotus varieties on the X-axe (Allele 1 with FAM) and Y-axe (Allele 2 with HEX). RFU is the Relative Fluorescence Units. Red dots represent varieties have the FAM-type allele 1; green dots represent varieties have the HEX-type allele 2; blue dot represents the NTC (non-template control). b, c, and d: Boxplot of Perimeter, REI, and sugar content in group I (SNP genotype: CC), group II (SNP genotype: TT), and group III (SNP genotype: C/T), respectively. The straight line represents median, the dotted line shows mean value and open circles indicate outliers. Upper and lower lines indicate maximum and minimum values. *, P < 0.05; **, P < 0.01. ns, not significant

