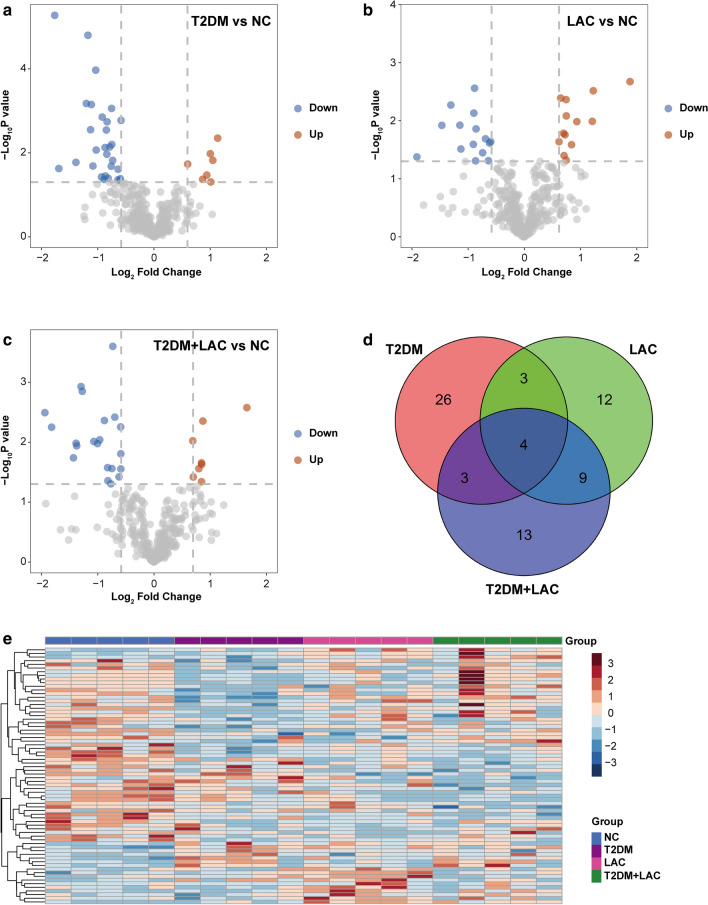
Fig. 2.
Identification of unique serum proteins in T2DM patients with LAC. a–c Volcano plot showing the DEPs in the T2DM, LAC and T2DM + LAC patients compared to healthy controls. d Venn diagram of the 70 differentially expressed proteins in the serum samples from the four comparisons (T2DM vs. NC, LAC vs. NC and T2DM + LAC vs. NC). In total, 13 proteins were specifically expressed in the T2DM + LAC group. e Hierarchical cluster analysis of the 70 DEPs in the NC, T2DM, LAC, and T2DM + LAC serum samples. Note: There were five samples in each group. Pseudocolors indicate differential expression (red, upregulation; blue, downregulation)

