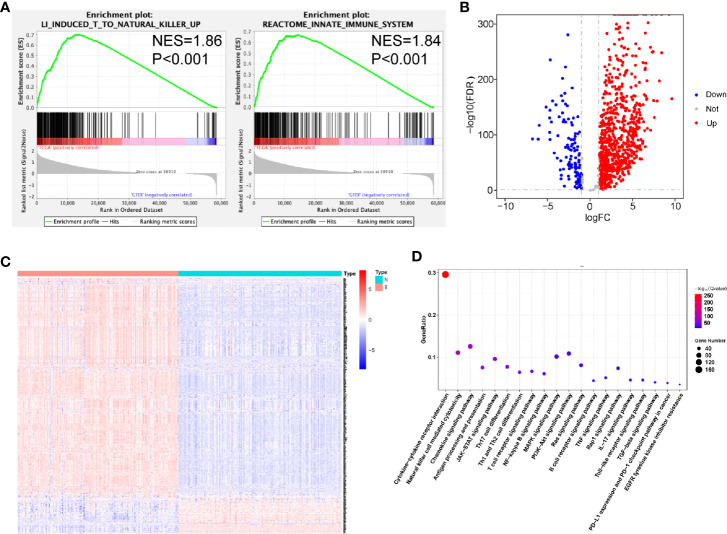
Figure 1.
Relationships between pancreatic ductal adenocarcinoma (PDAC) and normal pancreatic tissues. (A) Significant enrichment of immune-related pathways in tissues from patients with PDAC, compared with normal pancreatic tissues. NES, normalized enrichment score. (B) Volcano plot of 871 metabolism-related genes differentially expressed in PDAC and normal pancreatic samples. (C) Heatmap showing the expression of IRGs in each sample. (D) Functional analysis of 838 metabolism-related genes.

