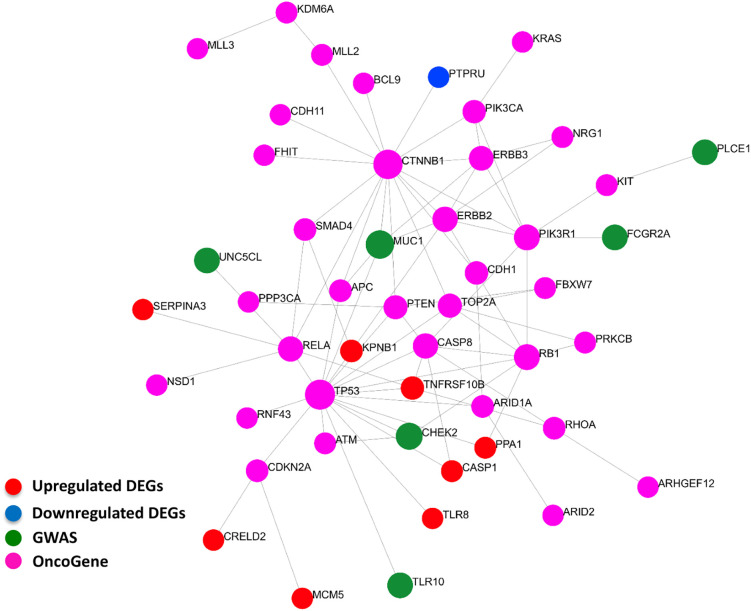
Figure 7.
Interactions between signature derived genes and genome-wide-associated and cancer driver genes. The genes of the 55-gene signature were integrated with 37 GWAS and 61 cancer driver genes in NetworkAnalyst tools to visualize gene interactions. A “zero order” interaction network with 49 nodes and 81 edges was used. The most highly ranked nodes across the dataset based on network topology measures were TP53 (betweenness centrality = 468.99), and CTNNB1 (betweenness centrality = 450.38). TNFRSF10B (betweenness centrality = 32.53) ranked the highest among the gene signature and MUC1 (betweenness centrality = 43.66) among GWAS genes. (Red = up-regulated DEGs; Blue = down-regulated DEGs; Green = GWAS; Purple = OncoGene).

