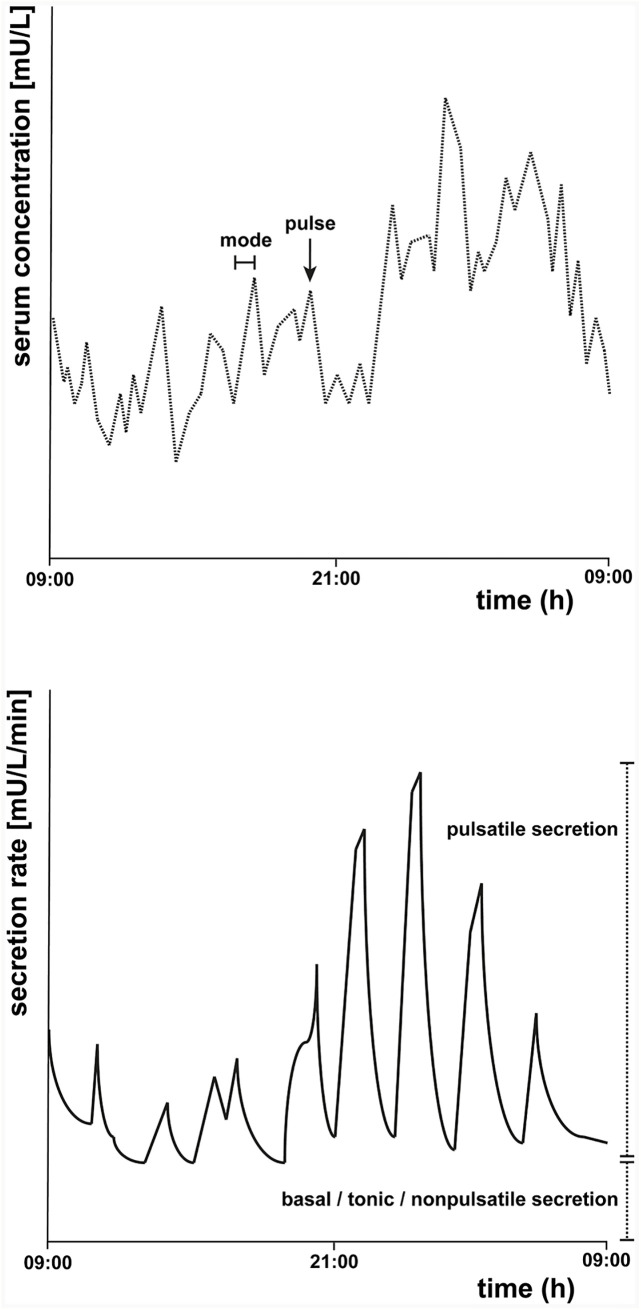
Figure 1.
Schematic representation of a fictional 24-h thyroid-stimulating hormone (TSH) concentration profile (top) and secretion rate (bottom). The top figure represents an example of a 24-h TSH concentration profile starting at 09:00 h. A pulse and the mode of one pulse, which is the time it takes before the pulse reaches its maximum, are indicated. The bottom figure is a schematic representation of an example of the secretion rate, which can be determined by deconvolution analysis. The basal tonic (or non-pulsatile) secretion and the pulsatile secretion together contribute to the total TSH secretion.

