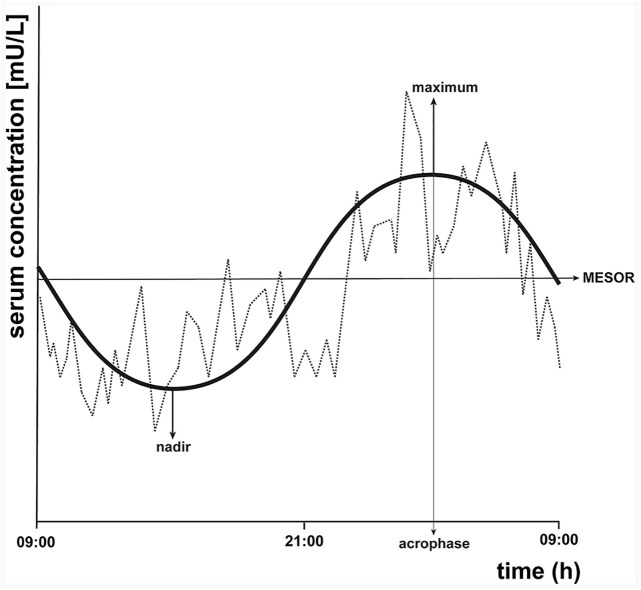
Figure 2.
Schematic representation of a fictional 24-h thyroid-stimulating hormone (TSH) concentration profile with cosinor model parameters. A cosinor model with its parameters is drawn on the same fictional 24-h TSH concentration profile of Figure 1 to illustrate the circadian rhythm of TSH. Cosinor analysis calculates the midline estimating statistic of rhythm (MESOR), which is a circadian rhythm-adjusted mean, the maximum, the nadir (minimum), the amplitude, and the acrophase, which is the time at which the cosinor model reaches its maximal value.

