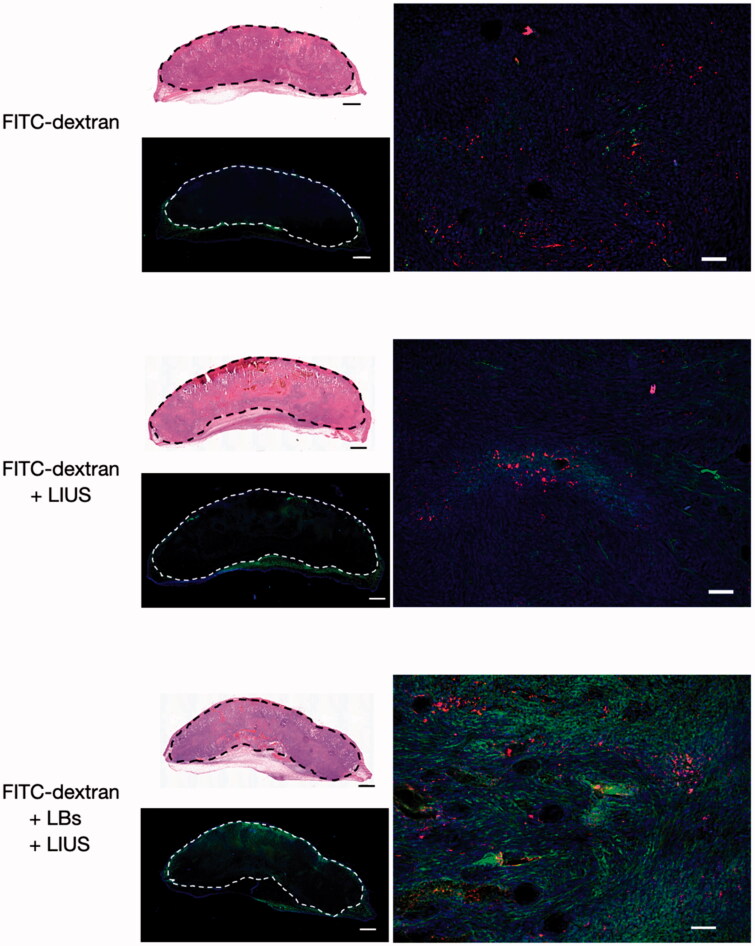
Figure 5.
Fluorescent images of the tumor tissues treated with lipid bubbles (LBs) and low-intensity ultrasound (LIUS). A mixture of fluorescein isothiocyanate-labeled dextran (FITC-dextran) and LBs was injected through the tail vein, and the tumor tissue was immediately exposed to LIUS. After 1 h, the tumor was excised and fixed in paraformaldehyde. Consecutive 30-μm cryosections were prepared for immunofluorescence analysis and staining with hematoxylin and eosin. Whole-tumor images were obtained by combining multiple low-magnification images using a BZ-X810 microscope. The areas within the dashed lines indicate the tumor tissues. Green: FITC-dextran, red: CD31 antigen (indicating tumor endothelial cells), and blue: nuclei stained with 4′-6-diamidino-2-phenylindole (DAPI) in the fluorescent images. Scale bar: 1 mm in whole-tumor images and 50 μm in high-magnification images.

