
Figure 3.
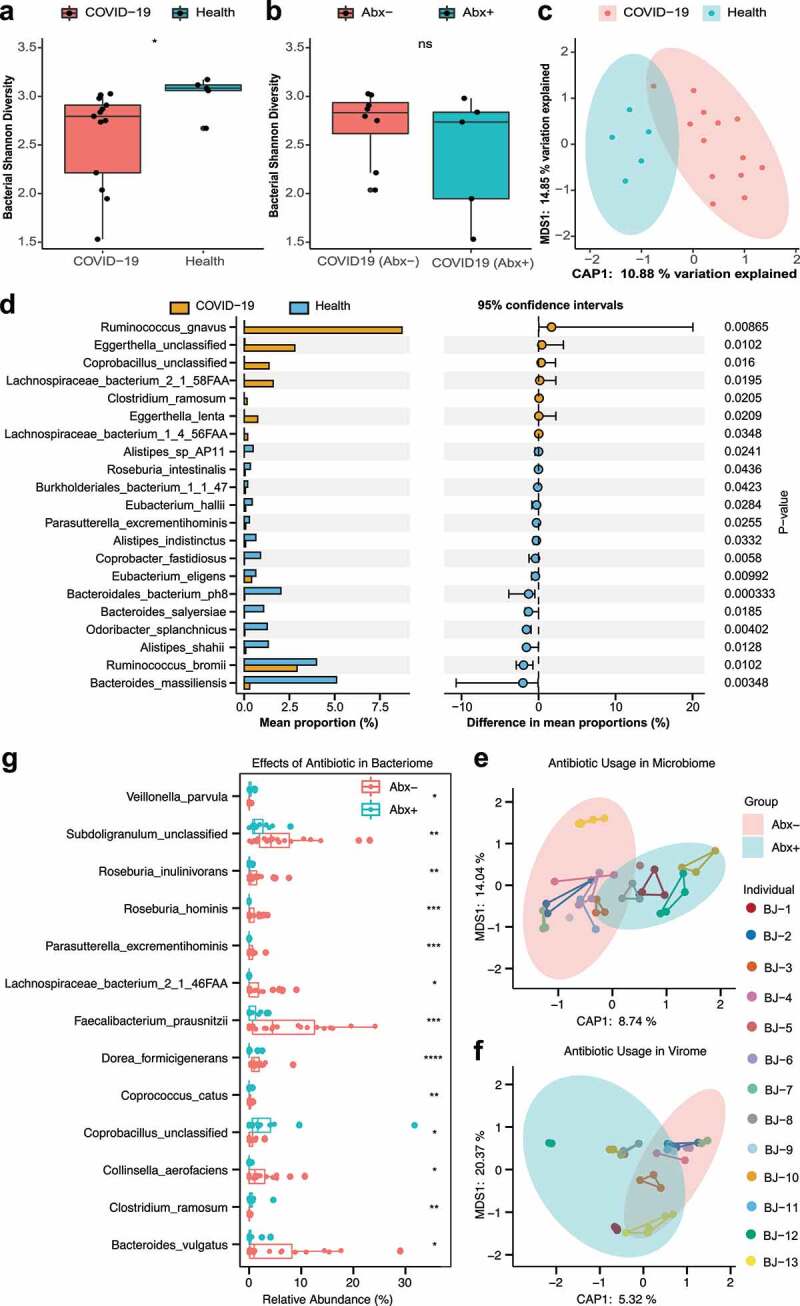
Alteration of bacterial communities and impact of antibiotics in COVID patients. (a) Box plot of bacterial Shannon diversity among COVID-19 patients and healthy controls. * represents P < .05 (Wilcoxon rank-sum test). (b) Box plot of bacterial Shannon diversity among COVID-19 patients without antibiotics (n = 8) and with antibiotics (n = 5). Abx– and Abx+ represent patients who were not treated with antibiotics and those who were treated with antibiotics during hospitalization, respectively (Wilcoxon rank-sum test). (c) Constrained PCoA plot based on Bray-Curtis dissimilarity between COVID-19 patients and healthy controls, P = .004, PERMANOVA. (d) Bar plot of differential bacterial communities among COVID-19 patients and healthy controls, which was performed using the Wilcoxon rank-sum test (P < .05). The orange bar represents fecal samples from patients with COVID-19, and blue bar represents healthy controls. (e) Constrained PCoA plot of the bacteriome in patient fecal samples treated with antibiotics and patient fecal samples without antibiotics using Bray-Curtis dissimilarity, P = .001, PERMANOVA. Different samples of the same individual are connected by the same colored line. (f) Constrained PCoA plot of viral communities in patients’ fecal samples treated with antibiotics and patients’ fecal samples without antibiotics using Bray-Curtis dissimilarity, P = .021, PERMANOVA. (g) Boxplot of differential bacterial communities identified by MaAsLin2 within COVID-19 patient fecal samples treated with/without antibiotics. (Wilcoxon rank-sum test). * P < .05; ** P < .01; *** P < .001; **** P < .0001; colors: red represents patients treated without antibiotics while blue represents patients treated with antibiotics