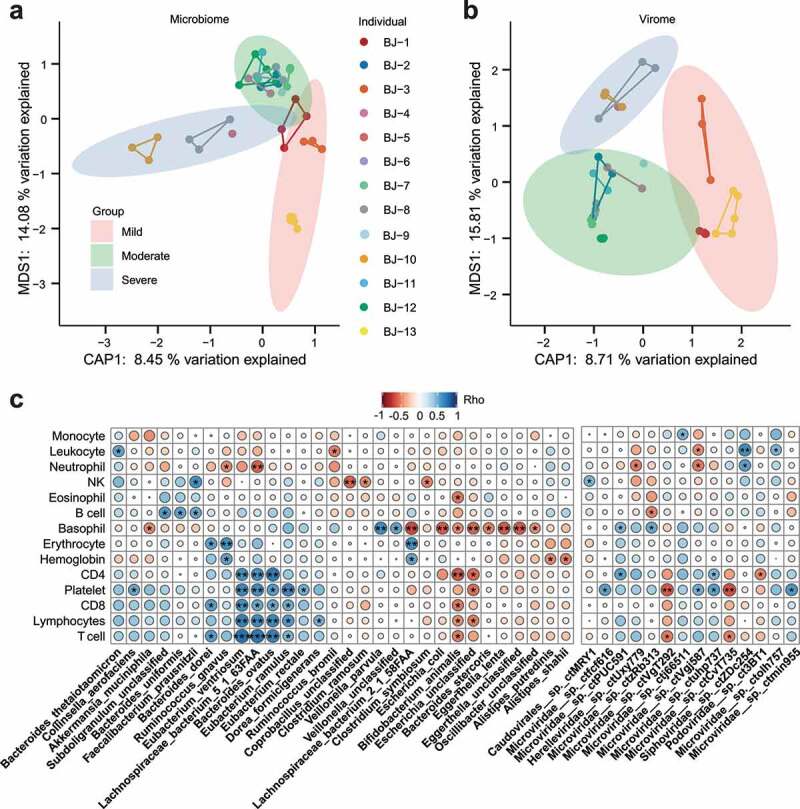
Figure 4.

Correlation of clinical information with bacterial and viral communities. (a) Constrained PCoA analysis for bacterial communities of COVID-19 patients’ fecal samples with three categories of disease severity, P = .001, PERMANOVA. Different samples of the same individual are connected by the same colored line. (b) Constrained PCoA analysis for viral communities of COVID-19 patients’ fecal samples with three categories of disease severity, P = .001, PERMANOVA. (c) Correlation heatmap between clinical information of COVID-19 and bacteriome/virome relative abundance with Spearman’s rank correlation coefficient. Red circles represent Rho < 0, blue circles represent Rho > 0, and the circle radius reflects the correlation coefficient (Rho). * P < .05; ** P < .01
