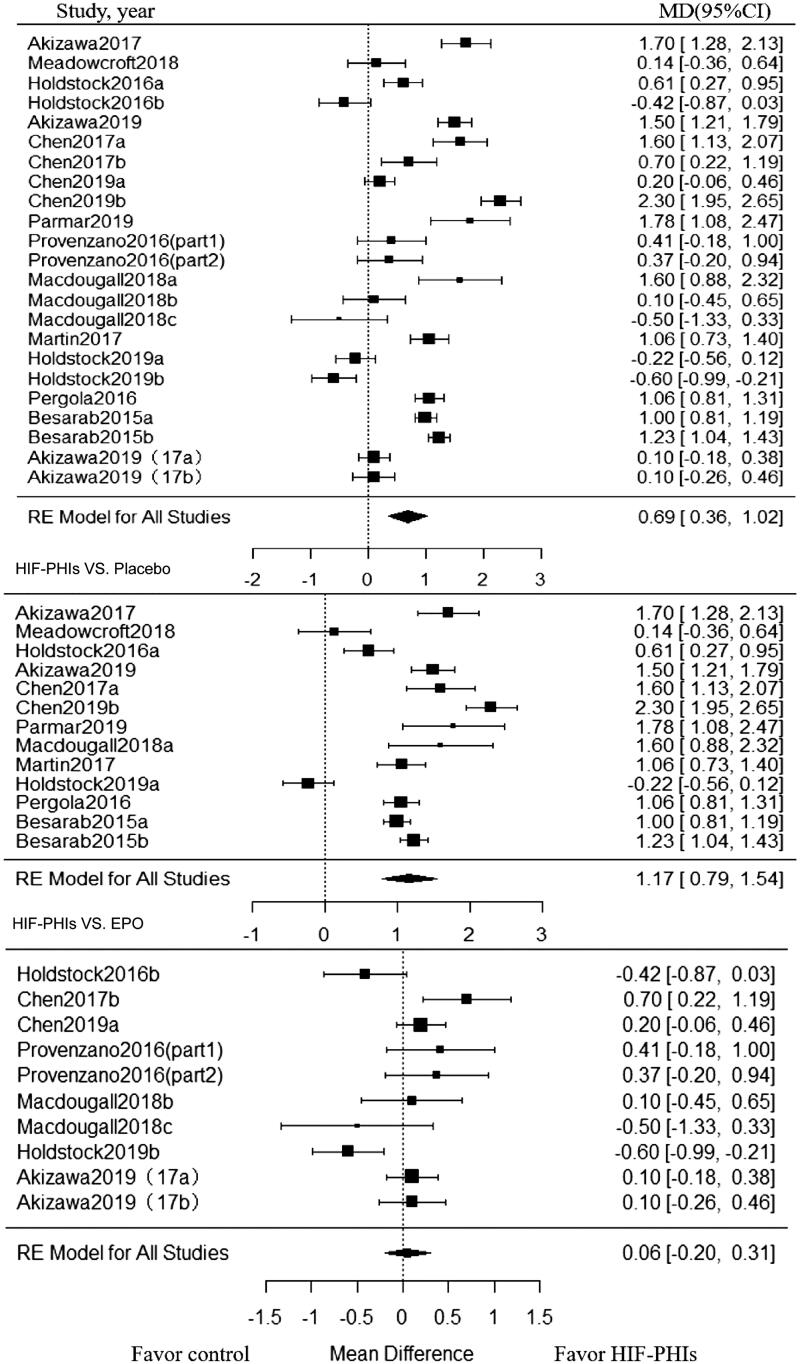
Figure 2.
Forest plot for hemoglobin change from baseline. Positive value in mean difference of Hb change represent better anemia correction in PHI group than in the control group. Abbreviations and definitions: MD, mean difference; CI, confidence interval; HIF-PHI, hypoxia inducible factor-Prolyl hydroxylase inhibitor.

