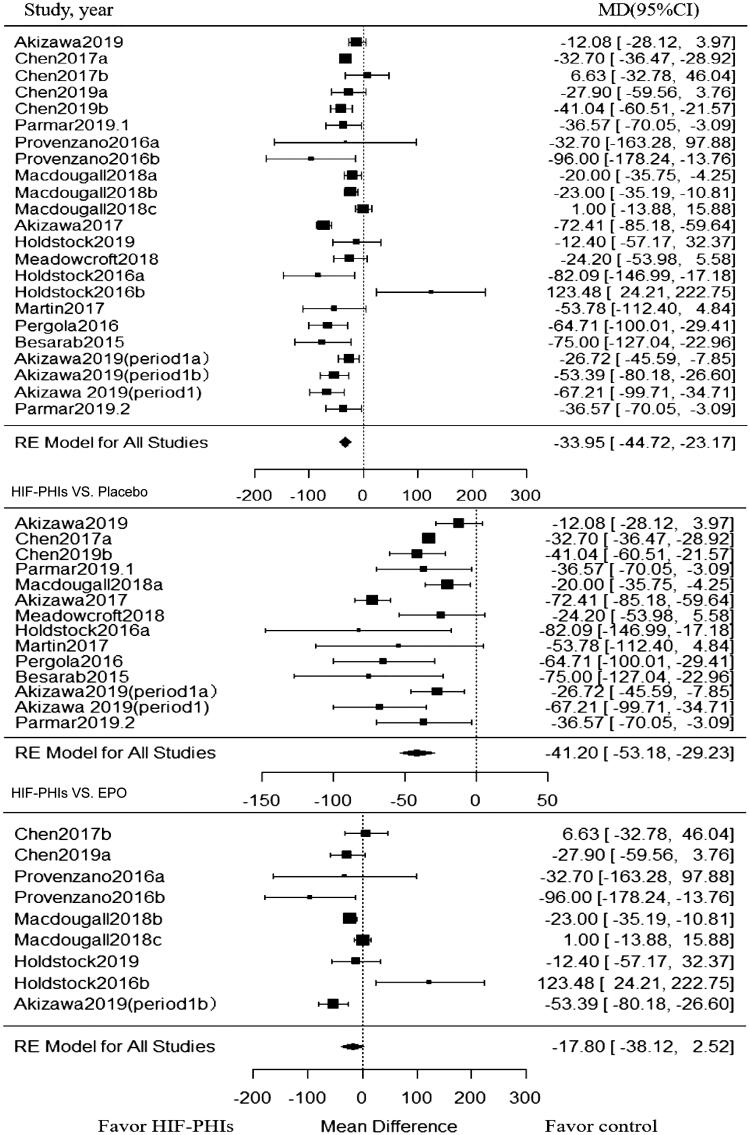
Figure 3.
Forest plot for hepcidin change from baseline. Positive value in mean difference of hepcidin change represent a significant lower level of hepcidin in PHI group than in the control group at the end of the treatment of PHI. Abbreviations and definitions: MD, mean difference; CI, confidence interval; HIF-PHI, hypoxia inducible factor-Prolyl hydroxylase inhibitor.

