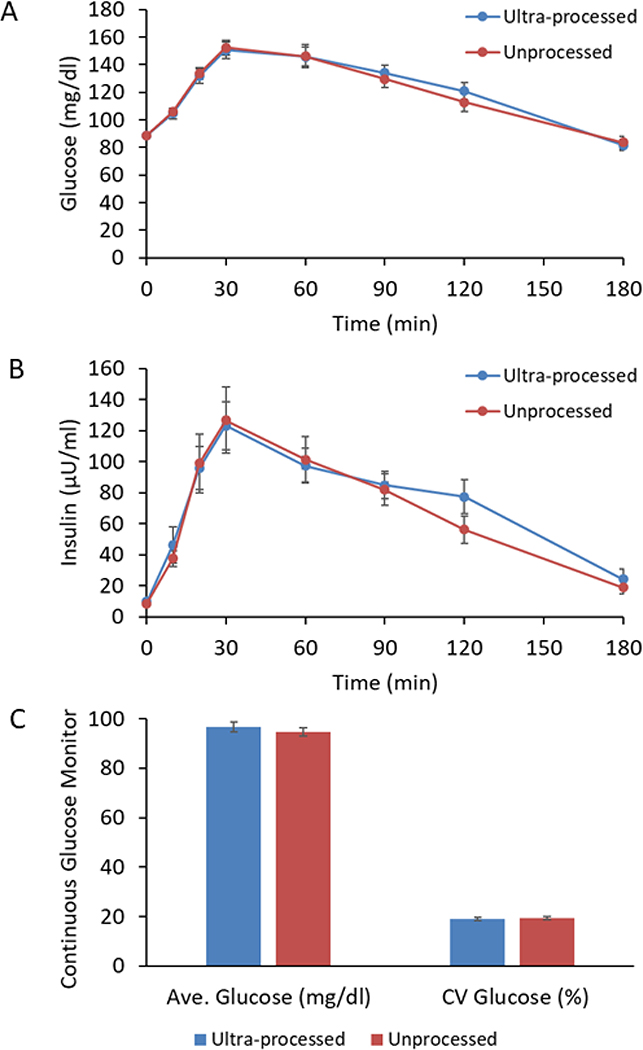
Figure 4. Glucose tolerance and continuous glucose monitoring.
A) Glucose concentrations following a 75g oral glucose tolerance test (OGTT) was not significantly different between the diets. B) Insulin concentrations following the OGTT were not significantly different between the diets. C) Continuous glucose monitoring throughout the study did not detect significant differences in average glucose concentrations or glycemic variability as measured by the coefficient of variation (CV) of glucose.

