Figure 2:

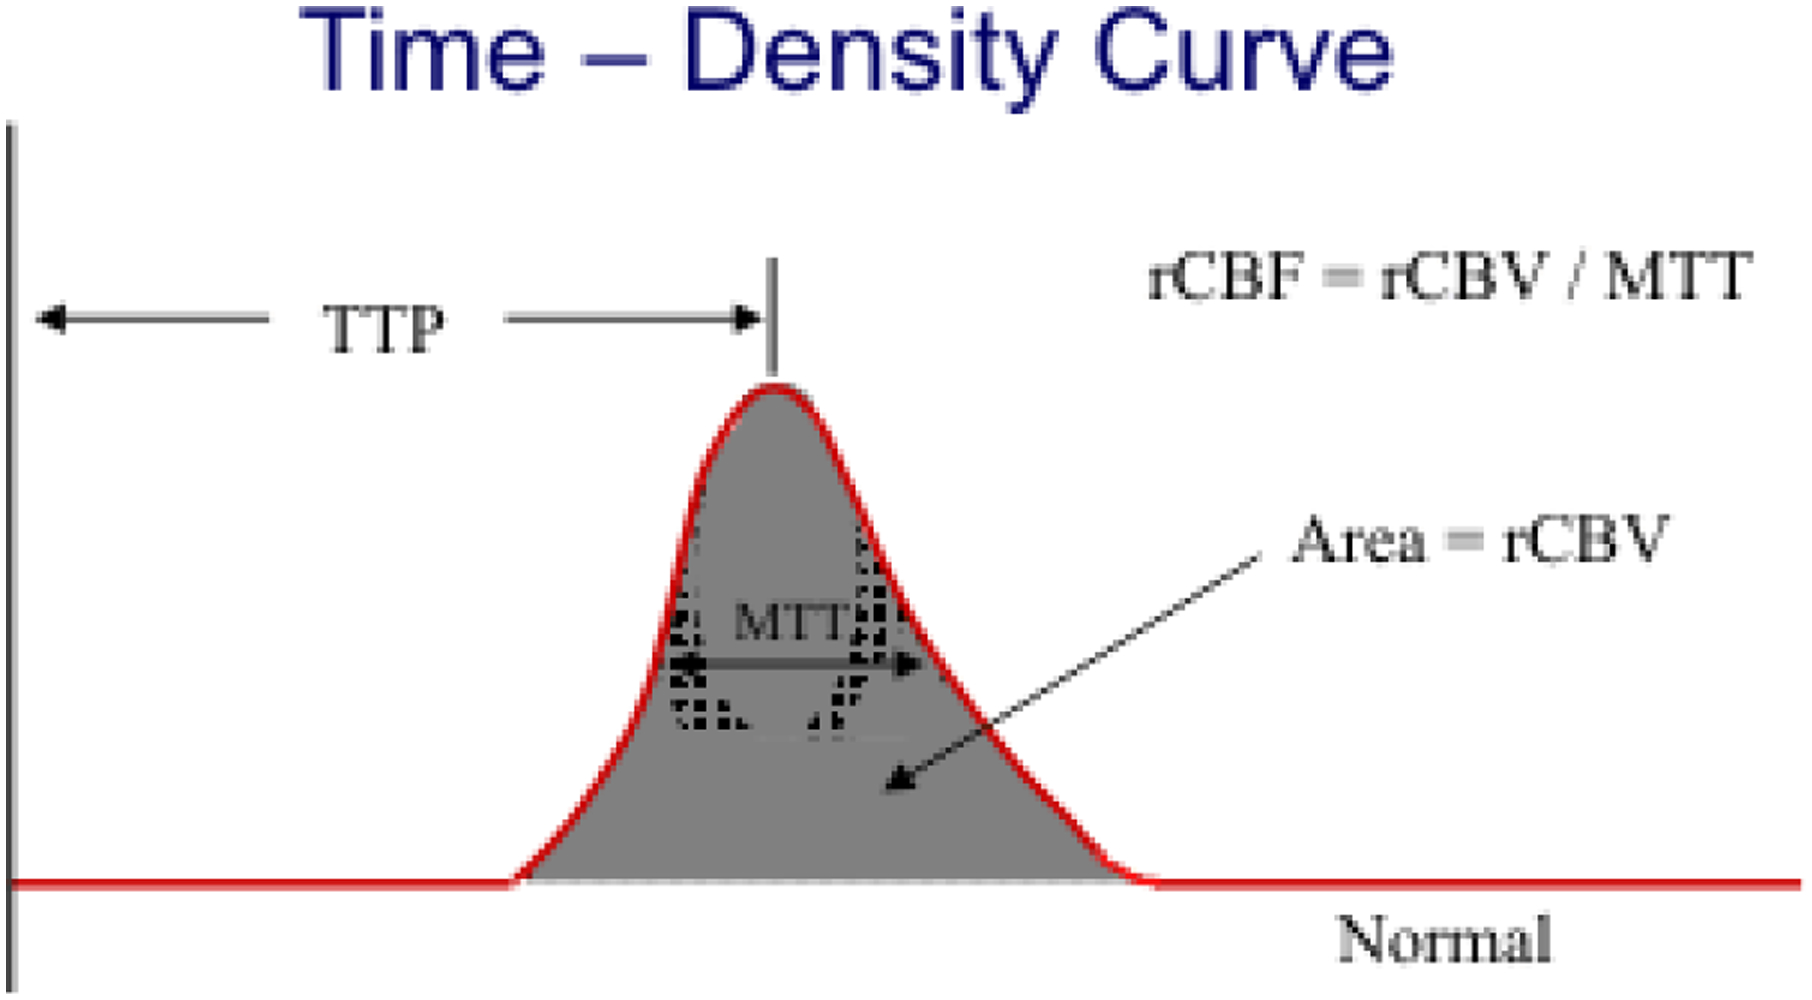
Demonstrates a TDC and how the CTP parameters are extracted from the curve. Delay time is excluded from the curve but represents the time at which the curve intensity goes above 0.10

Demonstrates a TDC and how the CTP parameters are extracted from the curve. Delay time is excluded from the curve but represents the time at which the curve intensity goes above 0.10