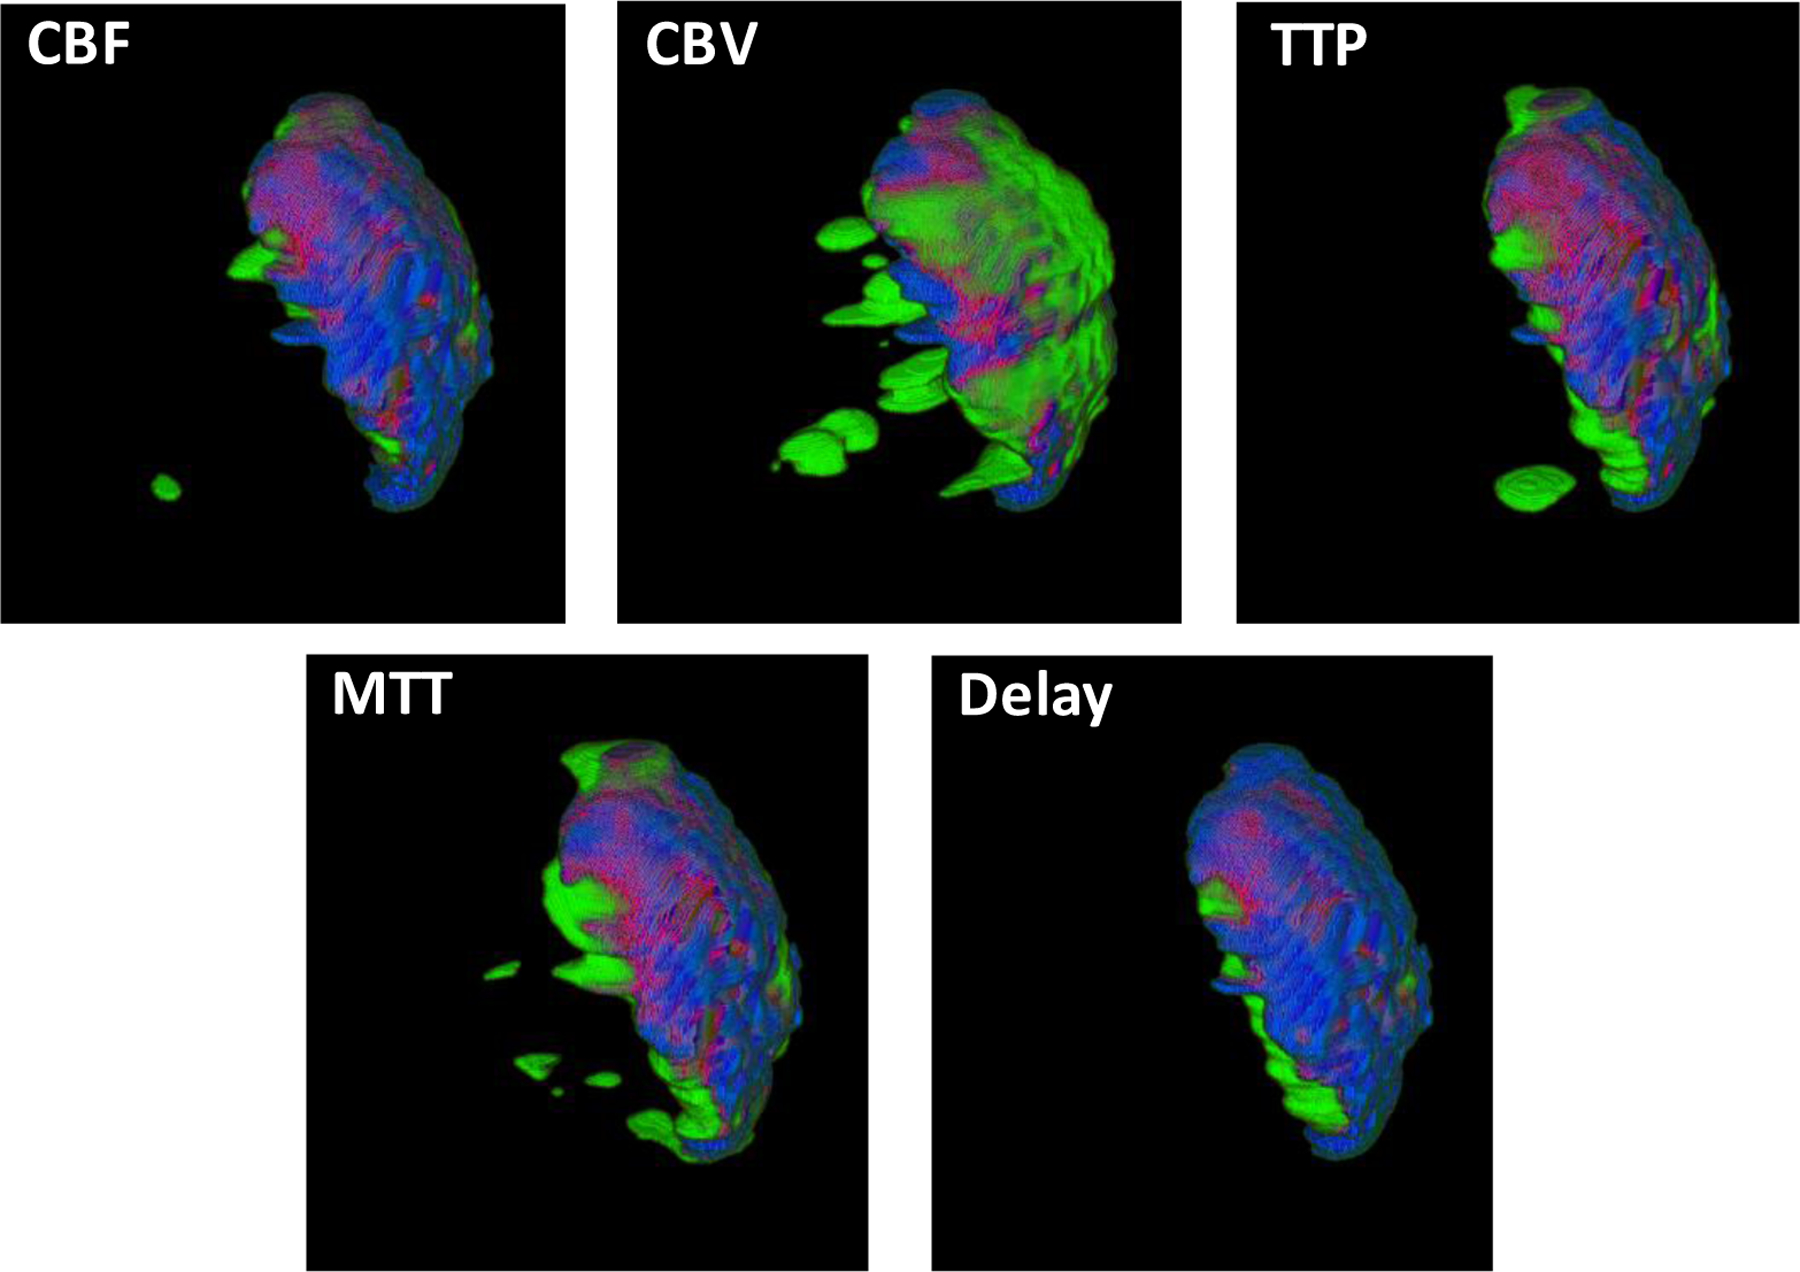
Figure 9:

Indicates the reconstructed CNN predicted CTP infarct volumes overlapping with the final infarct volumes from DWI. Maroon regions indicate infarct overlap between the two modalities, blue regions are infarct from just DWI, and green regions are CNN CTP predicted infarct.
