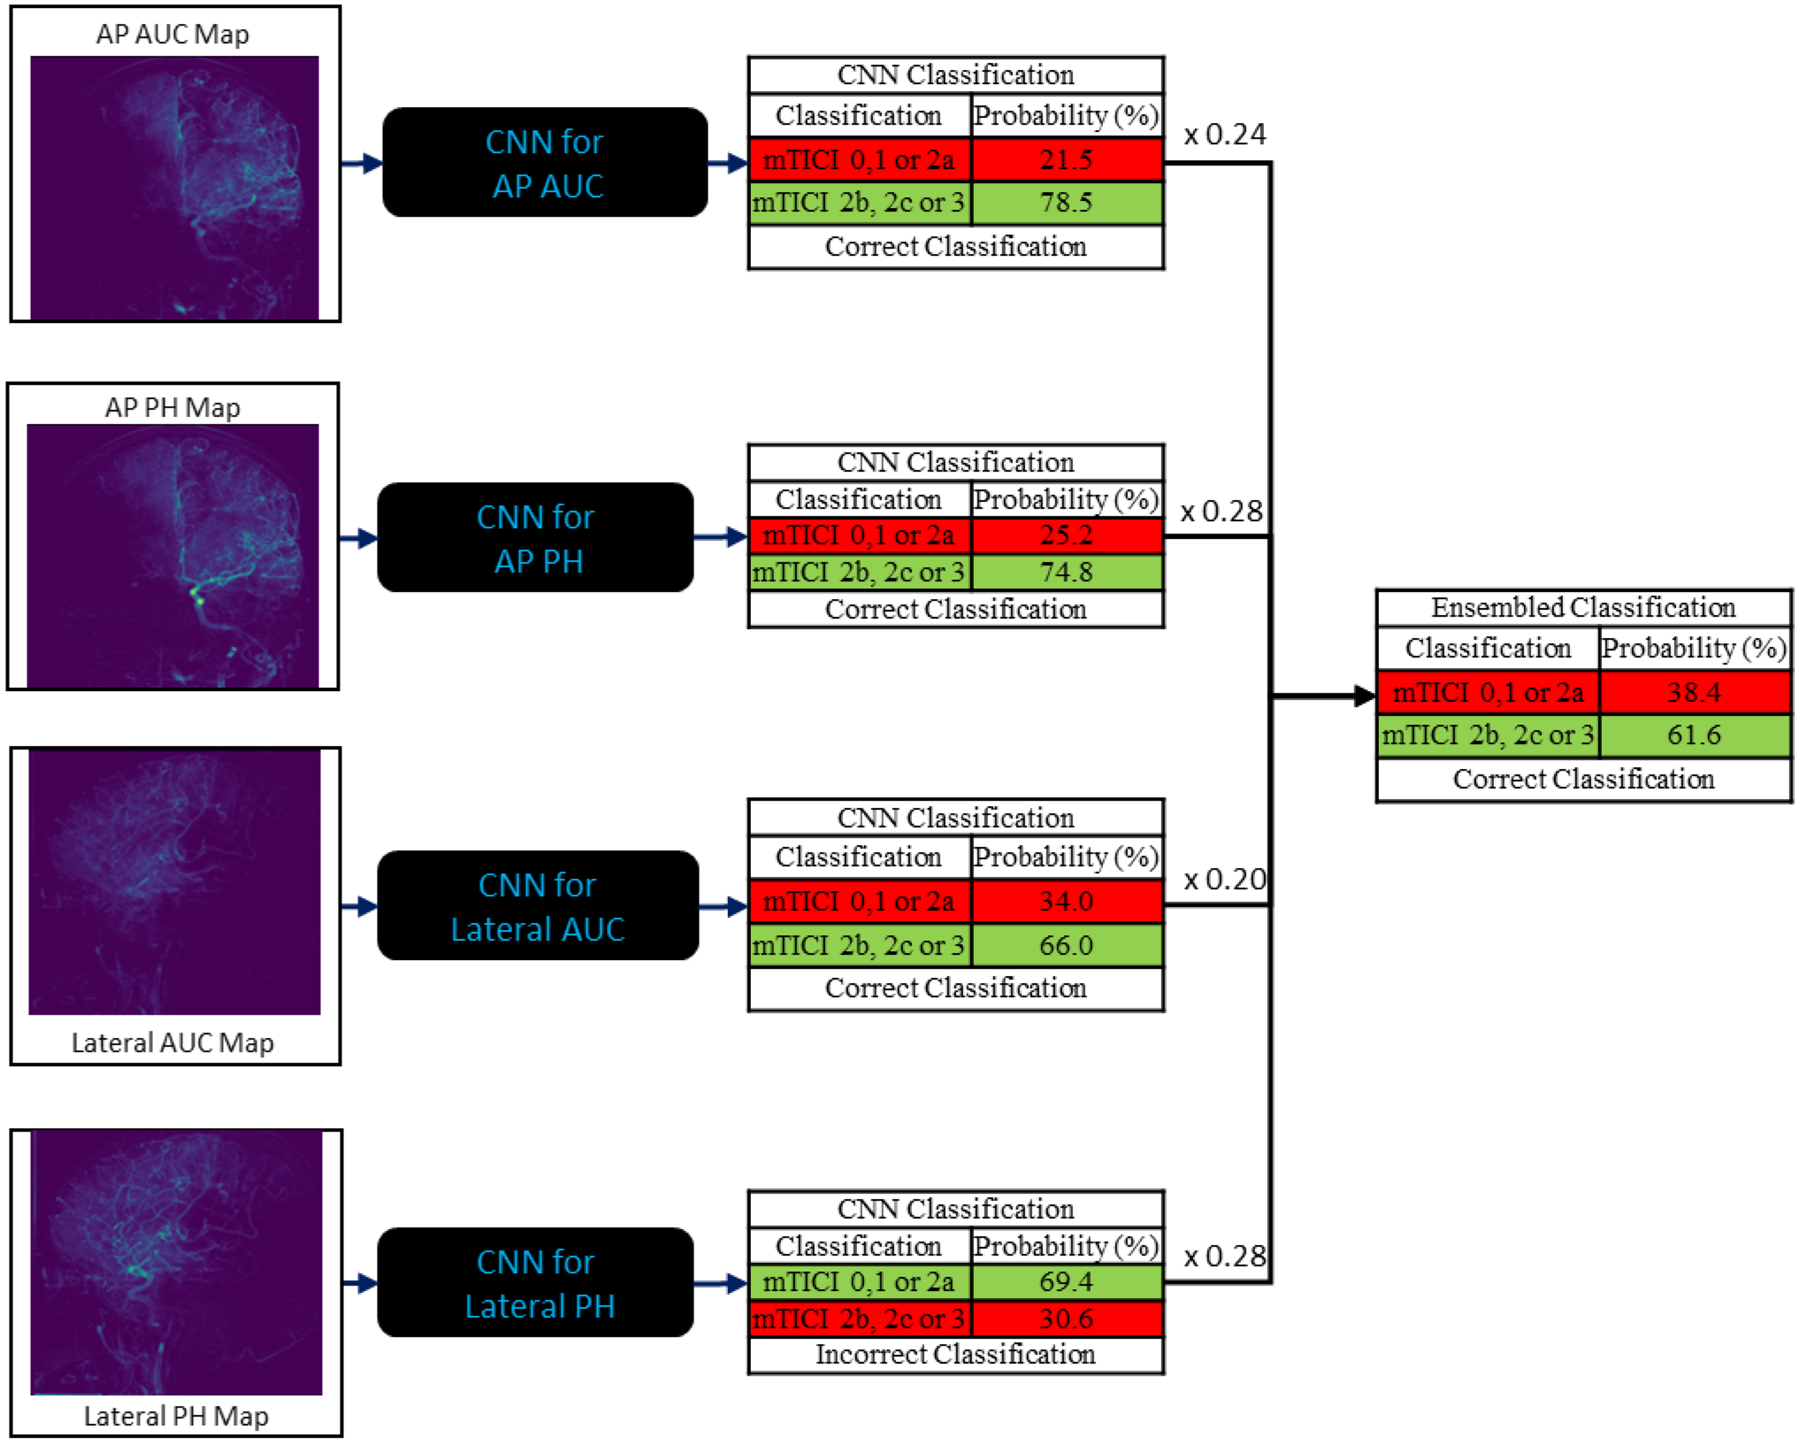
Figure 4:

An example case showing the anteroposterior (AP) and lateral view peak height (PH) and area under the time density curve (AUC) maps, the predictions from their respective networks, the weights given to each network, and the final ensembled classification after using the weights. The weights were obtained using the differential evolution optimization method.
