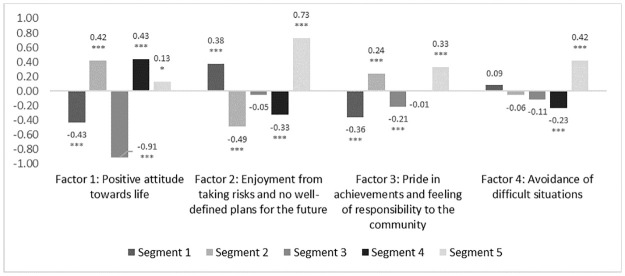
Fig 2. Attitudes to decision making and outlook on life across derived factors by segment.
* P<0.05, ** P<0.01, *** P<0.001, Segment values tested against sample total (standardised to 0). The factors scores were standardized with a mean of 0, meaning a bar above the x-axis represents a higher level of identification with that construct among that segment than average, and bars below the line represent a lower level of identification than average.

