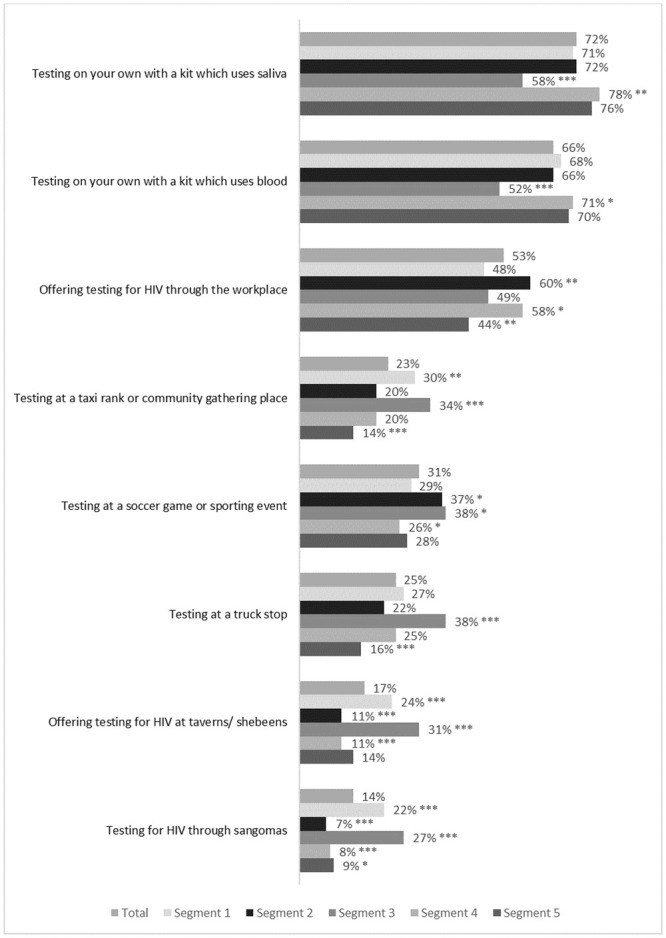
Fig 5. Percentage of respondents in each segment who believe that each service delivery option is a good idea or a very good idea.

Unweighted sample results, n = 2019. * P<0.05, ** P<0.01, *** P<0.001 Segment values tested against sample total.

Unweighted sample results, n = 2019. * P<0.05, ** P<0.01, *** P<0.001 Segment values tested against sample total.