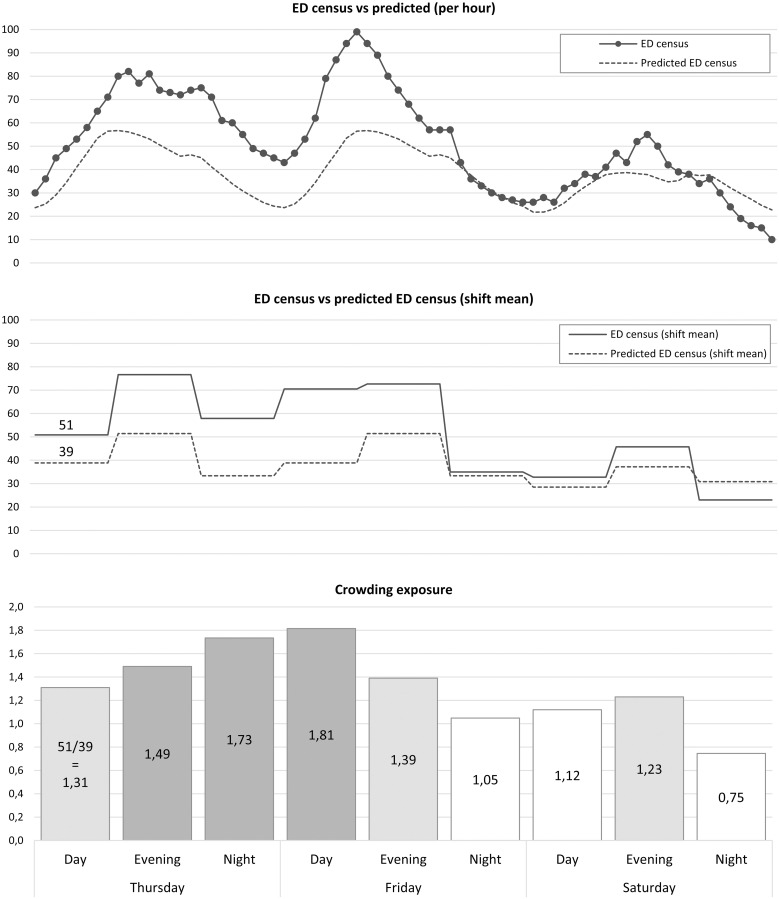
Fig 1. Definition of crowding exposure.
The actual and predicted ED census for each specific ED and hour is calculated and one example can be seen in the top graph. From these numbers, the work-shift mean is calculated as can be seen in the middle graph. The exposure for all patients arriving during a specific shift is defined as the actual ED census for each work-shift divided with the predicted ED census for that shift, as can be seen in the bottom graph. For instance, the mean ED census during the Thursday dayshift was 51 patients. The mean expected ED census for the same shift was 39. This means that the crowding exposure for all patients arriving during the Thursday dayshift was 51/39 = 1.31.

