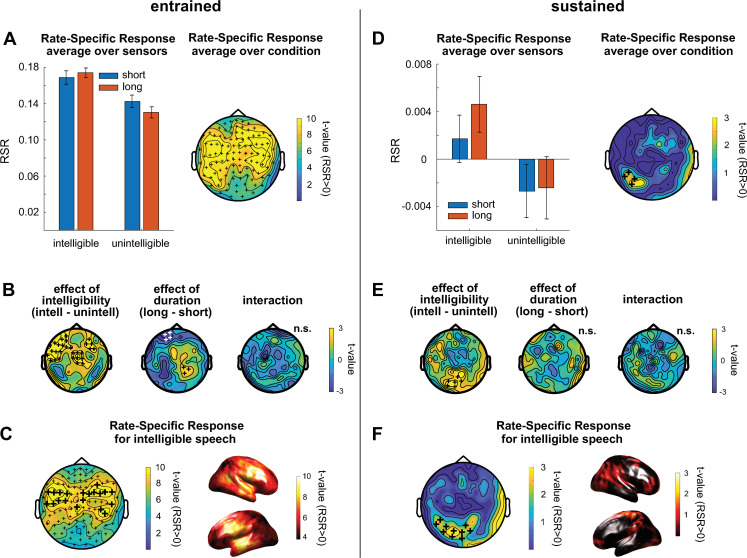
Fig 2. Main results from Experiment 1.
(A–C) Results in the entrained time window. Bars in panel A show RSR in the different conditions, averaged across gradiometers and participants. Error bars show SEM, corrected for within-subject comparison. The topography shows t-values for the comparison with 0, separately for the 102 gradiometer pairs, and after RSR was averaged across conditions. Topographies in B contrast RSR across conditions. Topography and source plots in C show t-values for the comparison with 0 in the intelligible conditions. In all topographic plots, plus signs indicate the spatial extent of significant clusters from cluster-based permutation tests (see Materials and methods). In B, white plus signs indicate a cluster with negative polarity (i.e., negative t-values) for the respective contrast. In A and C, this cluster includes all gradiometers (small plus signs). In C, larger plus signs show the 20 sensors with the highest RSR, selected for subsequent analyses (Fig 3). (D–F) Same as A–C, but for the sustained time window. Please refer to S1 Data for the numerical values underlying this figure. RSR, rate-specific response; SEM, standard error of mean.

