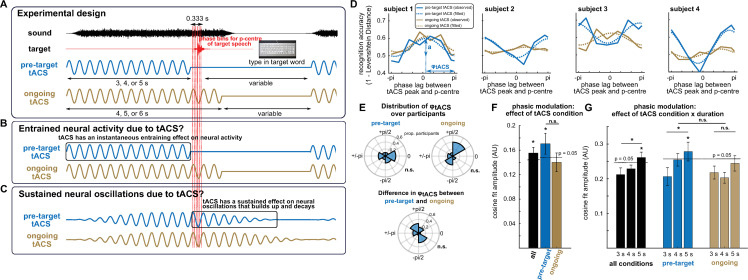
Fig 4. Experimental paradigm and main results from Experiment 2.
(A) Experimental paradigm. In each trial, a target word (red), embedded in noise (black), was presented so that its p-centre falls at 1 of 6 different phase lags (vertical red lines; the thicker red line corresponds to the p-centre of the example target), relative to preceding (“pretarget tACS”) or ongoing tACS (which was then turned off). After each trial, participants were asked to type in the word they had heard. The inset shows the electrode configuration used for tACS in both conditions. (B, C). Theoretical predictions. (B) In the case of entrained neural activity due to tACS, this would closely follow the applied current and hence modulate perception of the target word only in the ongoing tACS condition. (C) In the case that true oscillations are entrained by tACS, these would gradually decay after tACS offset, and a “rhythmic entrainment echo” might therefore be apparent as a sustained oscillatory effect on perception even in the pretarget condition. (D) Accuracy in the word report task as a function of phase lag (relative to tACS peak shown in (A), averaged across tACS durations, and for 4 example participants. Phasic modulation of word report was quantified by fitting a cosine function to data from individual participants (dashed lines). The amplitude (a) of this cosine reflects the magnitude of the hypothesized phasic modulation. The phase of this cosine (φtACS) reflects the distance between its peak and the maximal phase lag of π. Note that the phase lag with highest accuracy for the individual participants, estimated based on the cosine fit, therefore corresponds to π-φtACS. (E) Distribution of φtACS in the 2 tACS conditions, and their difference. (F, G) Amplitudes of the fitted cosines (cf. amplitude a in panel D), averaged across participants. In (F), cosine functions were fitted to data averaged over tACS duration (cf. panel D). In (G), cosine functions were fitted separately for the 3 durations. For the black bars, cosine amplitudes were averaged across the 2 tACS conditions. Dashed lines show the threshold for statistical significance (p < = 0.05) for a phasic modulation of task accuracy, obtained from a surrogate distribution (see Materials and methods). Error bars show SEM (corrected for within-subject comparisons in (F)). Please refer to S1 Data for the numerical values underlying panels E–G. n.s., not significant; SEM, standard error of mean; tACS, transcranial alternating current stimulation.

