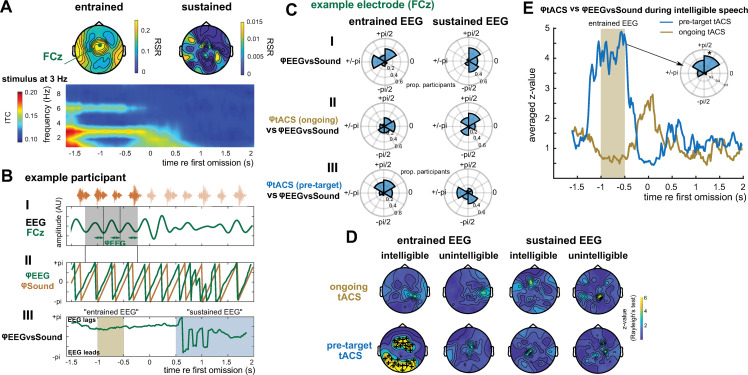
Fig 5. Combining Experiments 1 and 2.
(A) EEG results from Experiment 1. Topographies show RSR in the intelligible conditions. The time–frequency representation depicts ITC during 3-Hz sequences, averaged across EEG electrodes, participants, and conditions (cf. Fig 1C). (B) Illustration of methodological approach, using example data from 1 participant and electrode (FCz, green in panel A). (B-I) Band-pass filtered (2–4 Hz) version of the EEG signal that has been used to estimate φEEG in the panel below (B-II). In practice, EEG phase at 3 Hz was estimated using FFT applied to unfiltered EEG data. Consequently, φEEG reflects the distance between the peaks of a cosine, fitted to data within the analysis window (shaded grey), and the end of each 3-Hz cycle (green arrows). (B-II) φEEG (green; in the intelligible conditions and averaged across durations) and phase of the 3-Hz sequence (φSound, orange). The latter is defined so that the perceptual centre of each word corresponds to phase π (see example sound sequence, and its theoretical continuation, on top of panel B-I). (B-III) Circular difference between φEEG (green in B-II) and φSound (orange in B-II), yielding φEEGvsSound. Given that φ is defined based on a cosine, a positive difference means that EEG lags sound. (C) Distribution of individual φEEGvsSound, and its relation to φtACS. Data from 1 example electrode (FCz) is used to illustrate the procedure; main results and statistical outcomes are shown in panel D. (C-I) Distribution of φEEGvsSound (cf. B-III), extracted in the intelligible conditions, and averaged across durations and within the respective time windows (shaded brown and blue in B-III, respectively). (C-II,III) Distribution of the circular difference between φtACS (Fig 4E) and φEEGvsSound (C-I). Note that a nonuniform distribution (tested in panel D) indicates a consistent lag between individual φtACS and φEEGvsSound. (D) Z-values (obtained by means of a Rayleigh test; see Materials and methods), quantifying nonuniformity of the distributions shown in C-II,III for different combinations of experimental conditions. Plus signs show electrodes selected for follow-up analyses (FDR-corrected p < = 0.05). (E) Z-values shown in D for intelligible conditions as a function of time, averaged across selected EEG sensors (plus signs in D). For the electrode with the highest predictive value for tACS (F3), the inset shows the distribution of the circular difference between φtACS and φEEGvsSound in the pretarget condition, averaged within the entrained time window (shaded brown). Please refer to S1 Data for the numerical values underlying panels A, C–E. EEG, electroencephalography; FDR, false discovery rate; FFT, fast Fourier transformation; ITC, intertrial phase coherence; RSR, rate-specific response; tACS, transcranial alternating current stimulation.

