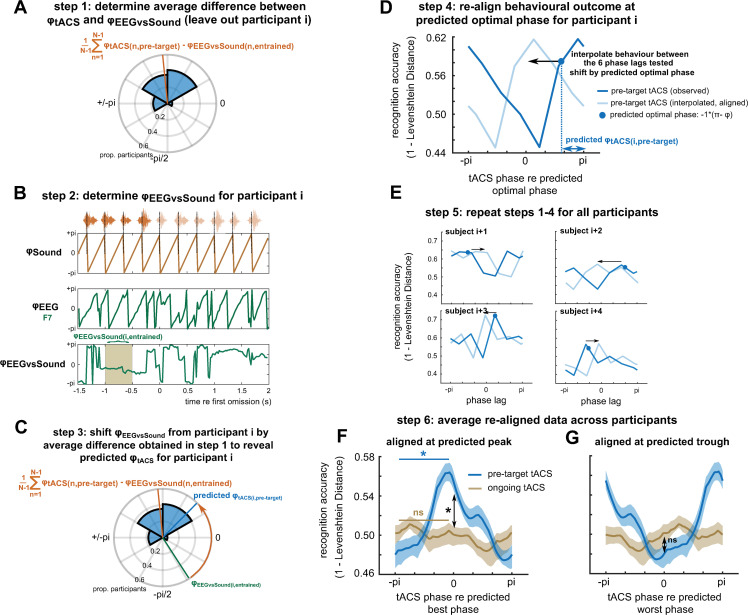
Fig 6. Predicted individual preferred tACS phases in the pretarget tACS condition from EEG data measured in the entrained time window at sensor F3.
(A) Step 1: For each participant i, data from all remaining participants were used to estimate the average difference between φtACS and φEEGvsSound. (B) Step 2: φEEGvsSound was determined for participant i. (C) Step 3: This φEEGvsSound was shifted by the phase difference obtained in step 1, yielding the predicted φtACS for participant i. (D) Step 4: The predicted φtACS was used to estimate the tACS phase lag with highest perceptual accuracy for participant i, and the corresponding behavioural data were shifted so that highest accuracy was located at a centre phase bin. Prior to this step, the behavioural data measured at the 6 different phase lags were interpolated to enable realignment with higher precision. (E) Step 5: This procedure was repeated for all participants. (F) Step 6: The realigned data were averaged across participants (blue). For comparison, the procedure was repeated for the ongoing tACS condition (using EEG data from the same sensor; brown). The shaded areas show SEM, corrected for within-subject comparison. (G). Same as in (F), but aligned at the predicted worst phase for word report accuracy. Please refer to S1 Data for the numerical values underlying panels F and G. EEG, electroencephalography; SEM, standard error of mean; tACS, transcranial alternating current stimulation.

