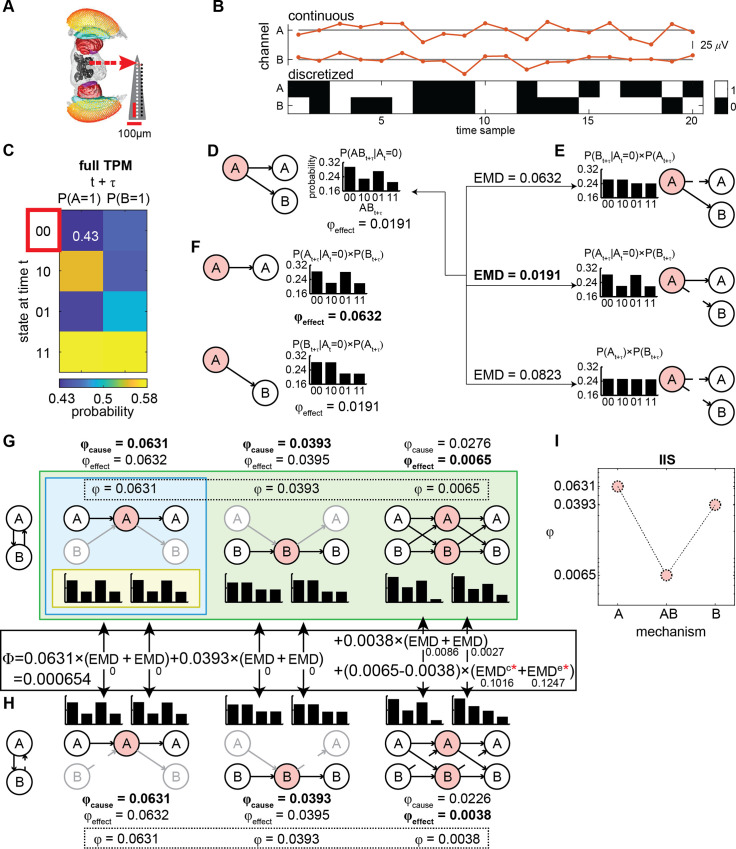
Fig 1. Summary of IIT and processing pipeline for computing the IIS from LFPs.
(A) Multi-electrode probe recording of LFPs from the fly. (B) Continuous LFPs (red, top) are discretized (black/white, bottom) by comparing to the median voltage for each trial. Displayed is an example of 20 samples for a set of two channels A and B. (C) A state-by-channel transition probability matrix (TPM; see Methods) describes how the state of a system at time t specifies the possible future states of each channel at time t+τ (τ = 4 ms). For example, the top left entry of the full TPM is 0.43, which represents the probability of channel A being ‘1’ at time t+τ given that channel A and B were both ‘0’ at time t. (D) At a given state (e.g. A = ‘0’ and B = ‘0’ at time t, outlined in red in C, the effect information specified by a subset (“mechanism”; here A, in light red) over the future states of another subset (“purview”; here A and B, in white), is given by the probability distribution of the purview conditioned on the current state of the mechanism. (E) To compute integrated information (φeffect) of mechanism A over purview AB, we find the disconnections (i.e. replacing connections with random-noise connections) between the mechanism and the purview (indicated by broken arrows) which best approximate the original probability distribution. We compare the disconnected probability distributions to the original distribution using the earth mover’s distance (EMD; treating probabilities as “earth” to be moved). We interpret the minimum EMD (bolded) as irreducible information generated over the purview by the mechanism (i.e. φeffect). (F) We compute φeffect for every possible purview (A, B, and AB as in D, with values 0.0632, 0.0191, and 0.0191 respectively), and select the purview and its associated probability distribution which gives the maximally integrated effect (bold). As probability distributions (bar graphs), we display the distribution over both channels A and B, assuming the maximum entropy distribution and independence on the channels outside of the purview. (G) φcause is determined in the same manner as φeffect, except looking at possible past states of the purview (at t-τ). Both φcause and φeffect, and their associated probability distributions, are determined for every mechanism (A, B, and AB; left and right distributions are cause and effect probability distributions of the selected purviews; channels outside of the purview are greyed out). The overall φ generated by a mechanism is the minimum of φcause and φeffect (bolded and in the dotted box). Yellow, blue, and green backgrounds (innermost, middle, and outermost rectangles) indicate correspondence with the IIT terminology of “cause-effect repertoire”, “concept”, and “cause-effect structure” (CES), respectively. (H) All φ values and associated probability distributions are re-computed for each possible uni-directional cut (again, replacing with random-noise connections) separating the channels into a feedforward interaction from one subset of channels to the remainder of the system. Broken lines here depict the cut removing channel B’s input to A. System-level integrated information (Φ) is the sum of distances between cause and effect probability distributions specified by the full and (minimally) disconnected system, weighted by the φ value for each mechanism (hence Φ is the minimum across all possible system level cuts; solid box between G and H; see Methods for details on EMDc and EMDe which are marked by red asterisks). Note that distances between 1-channel mechanisms were 0, not contributing to Φ, which we found to be the case in general (see also S6 Text about the role of 1-channel mechanism in our results). (I) We take the φ values of each mechanism (within the dotted box in G) to form the integrated information structure (IIS).

