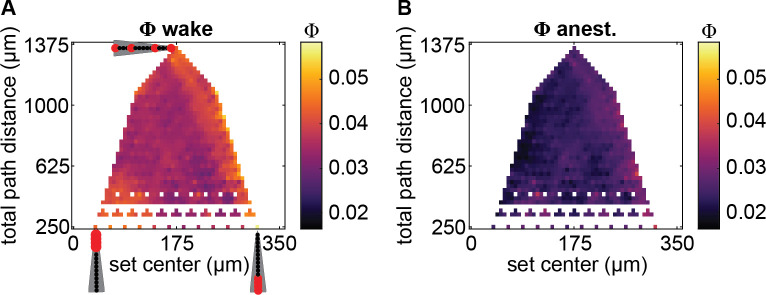
Fig 3. Spatial map of system-level integrated information Φ.
(A) System-level integrated information Φ values during wakefulness, averaged across flies, as a function of average channel location relative to the position of the most central channel (x-axis; larger values indicate channel sets which on average are more peripherally located), and sum of pairwise distances between each pair of channels (total path distance; y-axis) within each channel set. Channel arrays, as in Fig 1A, indicate example locations of channels (in red) and their spacing along the two axes. Channel sets with identical centers and path distances were averaged. A subset of otherwise unfilled values in the map were linearly interpolated to reduce gaps in the map. (B) System-level integrated information Φ values during anesthesia.

