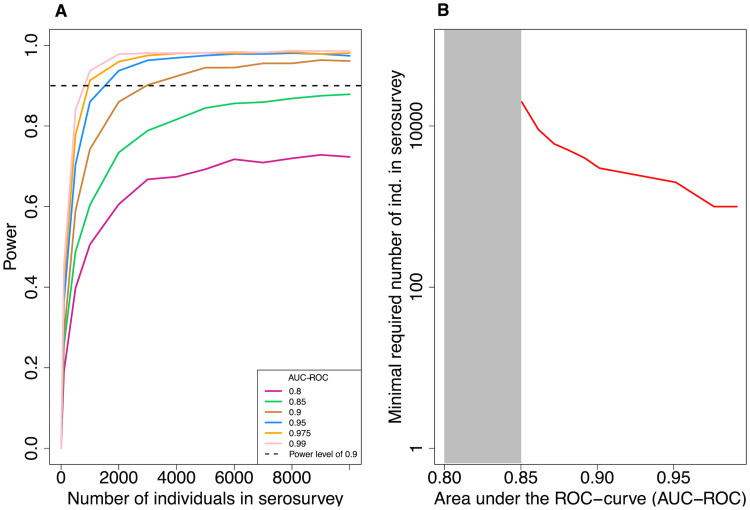
Fig 3. Statistical power of the mixture model.
In all simulations, the number of control and case data is fixed to 5, 000 each and the true cumulative incidence level is 8%. (A) Statistical power versus the number of individuals in the serosurvey for varying levels of test accuracy (AUC-ROC). The power is calculated as the fraction of simulated serosurveys that resulted in a cumulative incidence estimate that is within 25% of the true cumulative incidence and for which the true cumulative incidence level lies within 2 standard deviations of the estimated value. Each point in the graph represents the result of 3, 000 in silico serosurveys. (B) The minimal number of virtual individuals necessary to obtain a statistical power of 0.9 over a range of AUC-ROC values.

