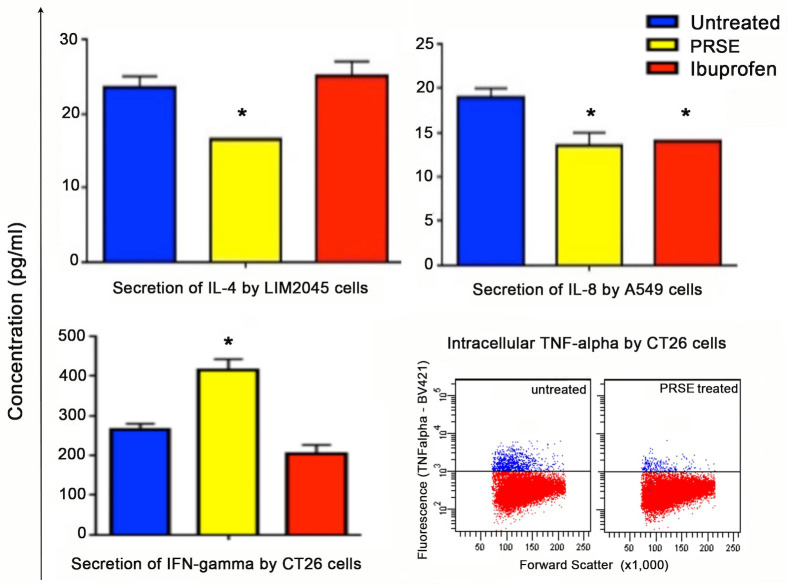
Fig 3.
Bioplex assay showing cytokine secretion (pg/ml) by LIM2045 (IL-4, p<0.05), A549 (IL-8, p<0.05) and CT26 (IFN-γ, p<0.05) in the presence of 400 μg/ml PRSE (yellow bars), ibuprofen (red bars) and untreated controls (blue bars). Flow cytometry (dot plots, lower right) of intracellular TNF-α expression by CT26 cells in the presence of 400 μg/ml PRSE or 100 μg/ml ibuprofen compared to untreated cells.

