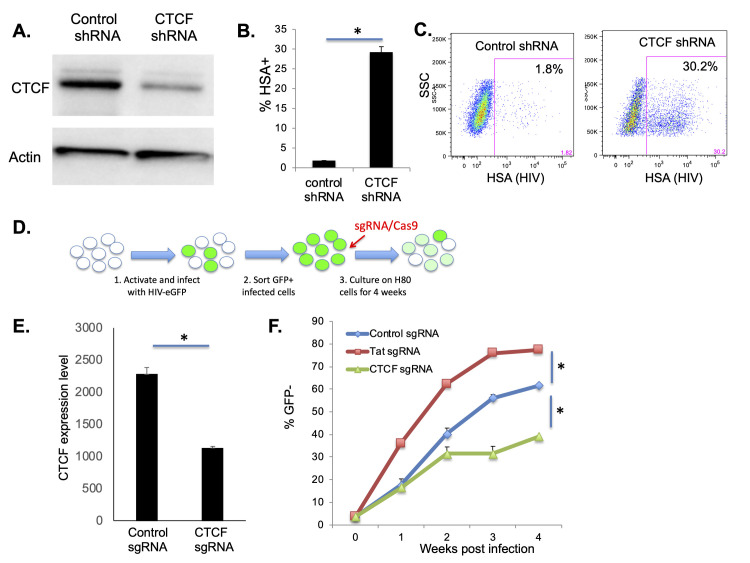
Fig 7. CTCF depletion in latently infected CD4 T cells inhibits HIV latency.
N6 cells were transduced with lentiviruses that express mCherry and an shRNA targeting CTCF or a control scrambled shRNA. A. Transduced N6 cells were analyzed by western blot to examine CTCF expression as well as a loading control (β-Actin). B. Transduced N6 cells were analyzed at 2 weeks post infection by flow cytometry, and the percentage GFP+ cells within the mCherry+ gate determined. Data represent the average of two technical replicates from one of two representative experiments. C. A representative FACS plot of HSA expression in shRNA transduced N6 cells. D. Primary CD4 T cells at 2 days post activation were infected with HIV-GFP, then nucleofected with Cas9 complexed with a control sgRNA, a Tat sgRNA or a CTCF sgRNA. E. At one week post infection, the impact on CTCF mRNA levels, relative to beta-actin was quantified by Taqman qPCR. CTCF expression is displayed in arbitrary units and represents the average of four replicates. F. The infected/nucleofected cells were analyzed for GFP expression over four weeks of infection and the percent of latently infected (GFP-) cells was determined. Each datapoint is the average of two independent nucleofection reactions. Asterisks represent significant differences (P<0.05, Student’s T test).

