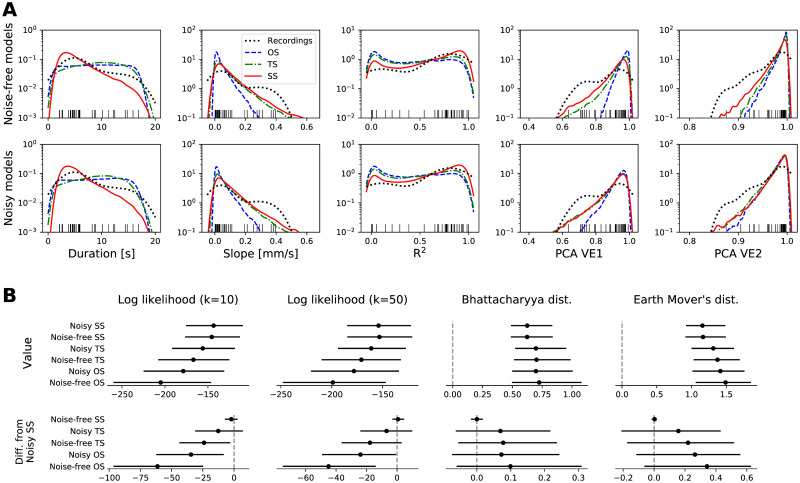
Fig 5.
(A) Features of the detected TAA groups in the recordings and simulations. Each panel shows the density of one of the five features of the TAA group (see Fig 3) obtained from the samples via kernel density estimation for noise-free (top row) and noisy (bottom row) simulations. Each black tick at the bottom edge corresponds to a TAA group in the recordings; these ticks match the density marked by the black dotted line, and are the same in both rows. (B) Quantification of the fit of the models to the empirical data. The four columns show the median and the confidence intervals at 95% level of four measures of a goodness-of-fit: k-nearest-neighbor estimation of log-likelihood (with k = 10 and k = 50; higher is better) and Bhattacharyya and Earth Mover’s distances (lower is better). Upper panels show the values itself, lower panels show the difference to the noisy spreading seizure model. To calculate the Bhattacharyya and Earth Mover’s distances, the samples were binned into 1024 uniform bins (each dimension divided into four bins) with limits indicated by the outermost ticks on x-axes in panel A. The confidence intervals are obtained by bootstrapping, that is repeatedly calculating given measure with a random resample with replacement from the original 32-element sample of detected TAA instances. Number of resamples was 1000, except for the Earth Mover’s distance where only 100 was used due to the computational demands. Abbreviation of the model names: OS—One homogeneous source, TS—Two homogeneous sources, SS—Spreading seizure.

