
Fig. 2. Nucleosomes inhibit Cas12a’s two-step DNA binding.
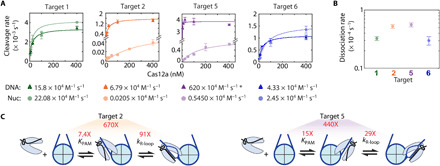
(A) Concentration-dependent Cas12a cleavage plots of DNA (dark triangles) and nucleosome substrates (light circles). Colored lines: Hyperbolic curve fitting. Second-order rate constants for each target are written below. The asterisk indicates that the target 5 DNA cleavage second-order rate constant is a lower limit due to lack of data points in the concentration-dependent phase. Each data point is the mean of at least three replicates; error bars: SEM. (B) Dissociation rates determined by electrophoretic mobility shift assay (fig. S2). Data points represent at least duplicates; error bars: SEM. (C) Diagrams showing the calculated nucleosomal inhibition on Cas12a PAM recognition and R-loop formation (fig. S2C). KPAM (Cas12a affinity for the targets’ PAM) increases and kR-loop (rate of R-loop formation) decreases due to the nucleosome.