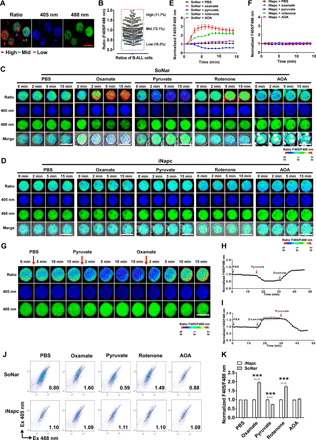
Fig. 1. SoNar can indicate the glycolysis or oxidative phosphorylation states of B-ALL cells at the single-cell level.

(A and B) Representative images of the ratio of SoNar fluorescence (F405/F488 nm) in murine SoNar B-ALL cells by confocal microscopy (A) and quantitative data are shown (B). A total of 204 SoNar B-ALL cells were calculated (n = 3). (C and D) Representative images of the ratio of SoNar fluorescence (C) and the control iNapc (D) fluorescence with excitation wavelengths at 405 and 488 nm in SoNar B-ALL cells at indicated time points upon treatments of phosphate-buffered saline (PBS), oxamate, pyruvate, rotenone, and AOA, respectively. (E and F) Quantification of the ratio of SoNar (E) and iNapc (F) in (C) and (D) is shown. A total of 25 to 30 SoNar B-ALL cells (E) and 25 to 30 iNapc-B-ALL cells (F) were measured (n = 3). (G and I) Shown are the representative images of the ratio of SoNar fluorescence in SoNar B-ALL cells upon the sequential treatments with pyruvate and oxamate (G) or vice versa (I). A total of 49 (H) or 58 (I) SoNar B-ALL cells were counted (n = 3). (J and K) Representative dot plots of the ratio of SoNar fluorescence in SoNar B-ALL cells upon treatments with PBS, oxamate, pyruvate, rotenone, and AOA (J). Quantification data in (J) are shown (K) (n = 3). This experiment was repeated independently three times. Scale bar, 10 μm. Data are represented as means ± SEM. Two-way analysis of variance (ANOVA) with Sidak’s multiple comparison test was used for the comparison of statistical significance (K). ***P < 0.001.
