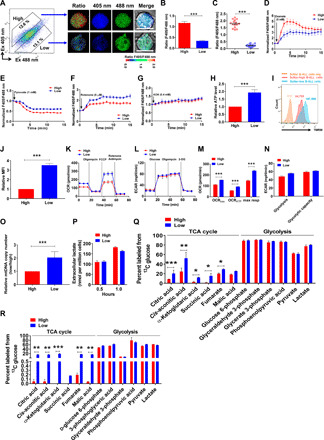
Fig. 2. SoNar-low B-ALL cells prefer using oxidative phosphorylation as the main energy source.

(A to C) FACS-purified SoNar-high and low B-ALL cells were evaluated for the ratio of SoNar fluorescence by confocal microscopy (A). Quantitative data in (A) as determined by either flow cytometric analysis (B) (n = 3) or confocal microscopy (C) (n = 3) are shown. Scale bar, 10 μm. (D to G) SoNar fluorescence ratios were measured in SoNar-high and low B-ALL cells upon treatment with oxamate, pyruvate, rotenone, and AOA. (H to J) ATP levels (H) and mitochondrial membrane potential (I) in SoNar-high and low B-ALL cells were measured by bioluminescence assay and TMRM staining (n = 3). MFI, mean fluorescence intensity. (K and L) OCRs (K) and extracellular acidification rates (ECAR) (L) were measured in SoNar-high and low B-ALL cells (n = 3). 2-DG, 2-deoxyglucose. mpH, mili potential of hydrogen. (M and N) basal respiration, ATP turnover, and maximum respiration in OCR (OCRbas, OCRATP, and max resp, respectively) (K) as well as glycolysis and glycolysis capacity in ECAR (L) were analyzed (n = 3). (O) Mitochondrial DNA (mtDNA) copies were detected in SoNar-high and low B-ALL cells (n = 3). (P) Extracellular lactate levels in SoNar-high and SoNar-low B-ALL cells (n = 3). (Q) The intermediate metabolites derived from glycolysis and TCA cycle were determined in SoNar-high and SoNar-low B-ALL cells after in vitro labeling with 13C-labeled glucose (n = 5). (R) 13C-labeled glucose was used for the in vivo labeling in SoNar B-ALL cells, followed by the measurement of intermediate metabolites derived from glycolysis and TCA cycle in SoNar-high and low leukemia cells (n = 3). Data are represented as means ± SEM. Student’s two-tailed unpaired t test (B, C, H, J, and O) and two-way ANOVA with Sidak’s multiple comparison test (M, N, P, Q, and R) were used for the comparison of statistical significance. *P < 0.05, **P < 0.01, and ***P < 0.001.
