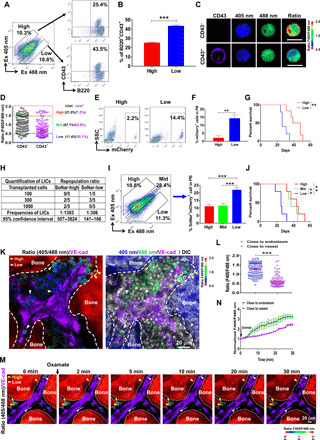
Fig. 3. The SoNar-low B-ALL cell population is enriched with functional LICs and resides in the vascular niche in the BM.

(A and B) The frequencies of B220+CD43+ cells evaluated by flow cytometry in SoNar-high and SoNar-low B-ALL cells are shown (B) (n = 3). This experiment was repeated independently three times. (C and D) The SoNar fluorescence ratios in CD43+/− B-ALL cells were determined by microscopy. A total of 94 to 95 SoNar B-ALL cells were counted (n = 3). Scale bars, 10 μm. (E to G) The mCherry+ B-ALL cell frequencies in the peripheral blood (PB) (E and F) (3 weeks) and overall survival (G) (log-rank test) of the recipient mice transplanted SoNar-high and SoNar-low cells are shown (n = 5). SSC, side scatter. (H) Functional LIC frequencies of primary B-ALL cells were determined by the limiting dilution assay using L-Calc software. (I and J) The frequencies of B-ALL cells in the peripheral blood (I) (3 weeks) and overall survival of the recipient mice (J) (log-rank test) receiving SoNar-high, SoNar-mid, and SoNar-low cells were determined (n = 5). (K and L) The B-ALL cell frequencies with indicated fluorescence ratios in the endosteal and vascular niches are shown. A total of 110 SoNar B-ALL cells were counted (n = 3). VE-cad, vascular endothelial cadherin; DIC, differential interference contrast. (M and N) The changes of the SoNar fluorescence ratio in B-ALL cells in the endosteal and vascular niche upon the oxamate stimulation are shown. A total of 46 to 47 SoNar B-ALL cells were counted (n = 3). Data are represented as means ± SEM. Student’s two-tailed unpaired t test (B, F, and L) and one-way ANOVA with Tukey’s multiple comparison test (I) were used for the comparison of statistical significance. **P < 0.01 and ***P < 0.001.
