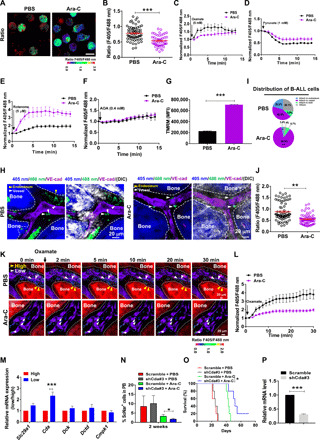
Fig. 5. SoNar-low B-ALL cells are resistant to Ara-C treatment as regulated by CDA pathways.

(A and B) The quantitation of fluorescence ratio in the SoNar B-ALL cells from the leukemia mice after 2-day Ara-C treatment. A total of 50 cells were counted (n = 3). Total BM leukemia cell numbers in each control or Ara-C–treated recipient mouse were 4.40 × 10⁷ or 2.03 × 10⁷, respectively. Scale bar, 10 μm. (C to F) The SoNar fluorescence ratio in the SoNar B-ALL cells in (A) was analyzed upon the stimulation with oxamate, pyruvate, rotenone, and AOA. (n = 3). (G) Mitochondrial membrane potential in Ara-C–treated SoNar B-ALL cells (n = 3). (H to J) The leukemia cell frequencies (H and I) and SoNar ratio (J) attached to the endosteum or vessel in the leukemic mice after 2-day Ara-C treatment. A total of 71 to 73 cells were counted (I and J) (n = 3). (K and L) The changes of SoNar ratio in SoNar B-ALL cells upon oxamate stimulation in (H) A total of 26 to 27 cells were counted (L) (n = 3). (M) The mRNA levels in genes related to the Ara-C transportation (Slc29a1) and catabolism (Cda, Dck, Dctd, and Cmpk1) in SoNar-high/SoNar-low cells (n = 3). (N to P) Percentages of the scrambled and Cda-knockdown TIB205 cells in the peripheral blood (N) and overall survival (O) of the recipient mice treated with/without Ara-C (n = 5 mice per group, log-rank test). Relative mRNA levels of Cda in (O) are shown (P) (n = 3). Data are represented as means ± SEM. Student’s two-tailed unpaired t test (B, G, J, and P), one-way ANOVA with Tukey’s multiple comparison test (N), and two-way ANOVA with Sidak’s multiple comparison test (I and M) were used for the comparison of statistical significance. *P < 0.05, **P < 0.01, and ***P < 0.001.
