
Fig. 2. Optogenetic identification of SUB projection neurons.
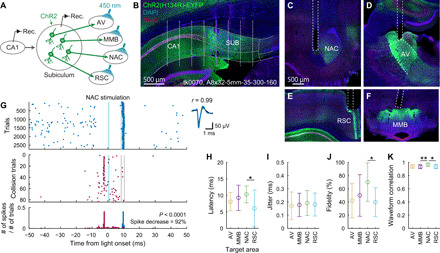
(A) Schematic of optogenetic identification. (B) Coronal section indicating ChR2 expression (green) and the estimated recording sites (white dots). Gray curves, borders of the CA1, SUB, and their cell layers. Text, animal ID and silicon probe name. (C to F) NAC (C), AV (D), RSC (E), and MMB (F) coronal sections containing ChR2-expressing SUB axons (green) and the reconstructed optical fiber locations (dotted lines). (G) Left: Spike responses of a SUB neuron upon light irradiation to the NAC. Evoked spikes (top) decreased when spontaneous spikes occurred shortly before the expected latency of evoked spikes (middle and bottom). Shaded blue areas, light stimulation periods. Gray lines, bin ranges of evoked spikes. Right: Mean waveforms of spontaneous (black) and evoked (blue) spikes. (H to J) Latency (H), jitter (I), and fidelity (J) of evoked spikes. (K) Waveform correlation between the evoked and spontaneous spikes. (H to K) Means ± SD. *P < 0.05 and **P < 0.01, Tukey test.