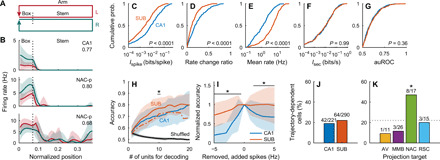
Fig. 5. Trajectory-dependent firing during an alternating T-maze task.

(A) Schematic of the behavioral task. (B) Rate maps of a CA1 and two NAC-p SUB neurons while rats were in the start box (normalized position, 0.02 to 0.07) and stem (normalized position, 0.07 to 0.38) of the T-maze. Numbers, auROC of the neuron. Red, left-arm trials. Green, right-arm trials. Means (solid lines) ± SD (shaded areas). (C to G) Cumulative distribution of Ispike (CA1, 0.034 ± 0.064 bits/spike; SUB, 0.011 ± 0.023 bits/spike) (C), rate change ratio (CA1, 0.24 ± 0.19; SUB, 0.15 ± 0.13) (D), mean firing rate (CA1, 2.3 ± 3.2 Hz; SUB, 6.8 ± 6.8 Hz) (E), Isec (CA1, 0.034 ± 0.063 bits/s; SUB, 0.040 ± 0.089 bits/s) (F), and auROC (CA1, 0.601 ± 0.084; SUB, 0.609 ± 0.091) (G) in the start box. P values: Wilcoxon rank sum test. (H) Accuracy of trajectory decoding averaged across all animals. Dashed-dotted line, SUB decoding accuracy calculated after randomly removing spikes from SUB neurons to match the CA1 mean firing rate (mean). Black line, chance level of decoding error estimated by a shuffling procedure. *P < 0.05, CA1 versus SUB solid lines, Bonferroni test after two-way ANOVA. (H and I) Means (solid lines) ± SD (shaded areas). (I) Normalized decoding accuracy after randomly removing (negative x values) or adding (positive x values) spikes to each neuron. Group data were averaged across all animals. *P < 0.05, Bonferroni test after two-way repeated-measures ANOVA. (J and K) Percentage of trajectory-dependent cells in the CA1 and SUB (J) and SUB projection neurons (K). Numbers, number of trajectory-dependent cells to the total number of neurons. Dotted line, percentage of trajectory-dependent cells in SUB neurons. *P < 0.05, bootstrap analysis.
