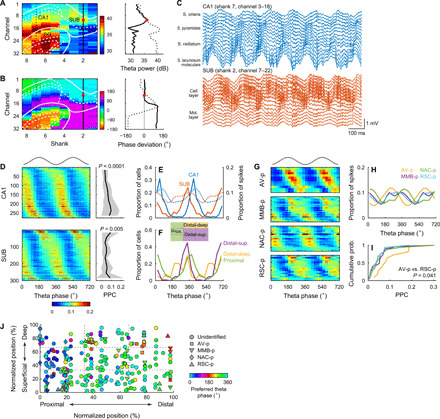
Fig. 7. Projection-specific theta phase locking during RUN periods.

(A and B) Distribution of theta power (A) and theta phase deviations (B) in an open field (left). White lines, borders of the CA1, SUB, and dentate gyrus (DG). Values along the CA1 (black dotted lines) and SUB (solid black lines) are plotted in the right. Red dots, the reference recording site with the maximal theta power in the SUB cell layer. (C) Wide-band local field potentials (LFPs) simultaneously recorded from the CA1 (top) and SUB (bottom). (D) Spike phase distribution along the reference SUB theta oscillations (left) and corresponding PPC (right) in the CA1 (top) and SUB (bottom). P values, one-way ANOVA. Means (solid lines) ± SD (shaded areas). (D and G) Top gray traces, idealized reference theta cycles. (E) Distribution of the preferred theta phases (left y axis, solid lines) and spike theta phases (right y axis, dotted lines). (F) Distribution of preferred theta phases for neurons located at proximal (green), distal-deep (yellow), and distal-superficial (purple) part of the SUB cell layer. (G) Spike phase distribution along the reference SUB theta oscillations in SUB projection neurons. (H and I) Distribution of the spike theta phases (H) and PPC (I) of SUB projection neurons. (J) Preferred theta phase plotted against cell location and projection target. Normalized positions indicate the anatomical cell location within the SUB cell layer.
