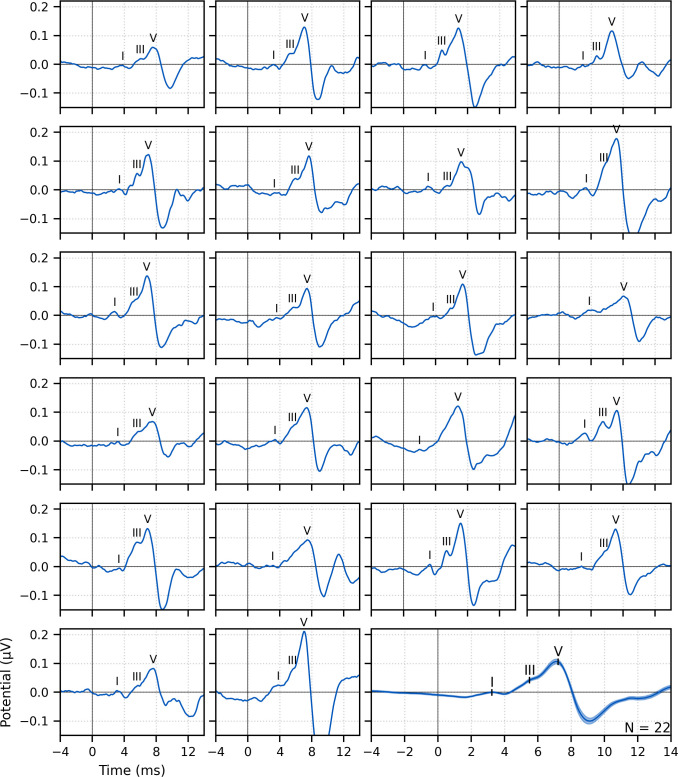
Figure 1. Single-subject and group average (bottom right) weighted-average auditory brainstem responses (ABRs) to ~43 min of broadband peaky speech.
Areas for the group average show ±1 SEM. Responses were high-pass filtered at 150 Hz using a first-order Butterworth filter. Waves I, III, and V of the canonical ABR are evident in most of the single-subject responses (N = 22, 16, and 22, respectively) and are marked by the average peak latencies on the average response.

