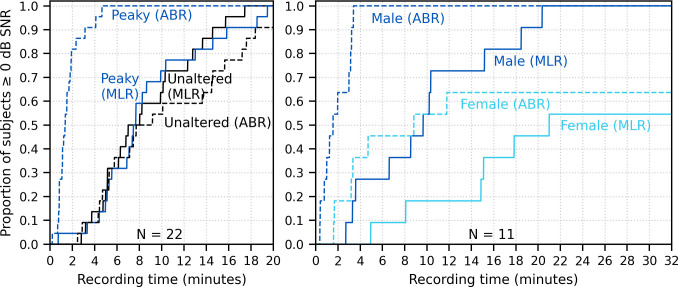
Figure 10. Cumulative proportion of subjects who have responses with ≥0 dB signal-to-noise ratio (SNR) as a function of recording time.
Time required for unaltered (black) and broadband peaky speech (dark blue) of a male narrator is shown for 22 subjects in the left plot, and for male (dark blue) and female (light blue) broadband peaky speech is shown for 11 subjects in the right plot. Solid lines denote SNRs calculated using variance of the signal high-pass filtered at 30 Hz over the auditory brainstem response (ABR)/middle latency response (MLR) interval 0–30 ms, and dashed lines denote SNR variances calculated on signals high-pass filtered at 150 Hz over the ABR interval 0–15 ms. Noise variance was calculated in the pre-stimulus interval −480 to −20 ms.

