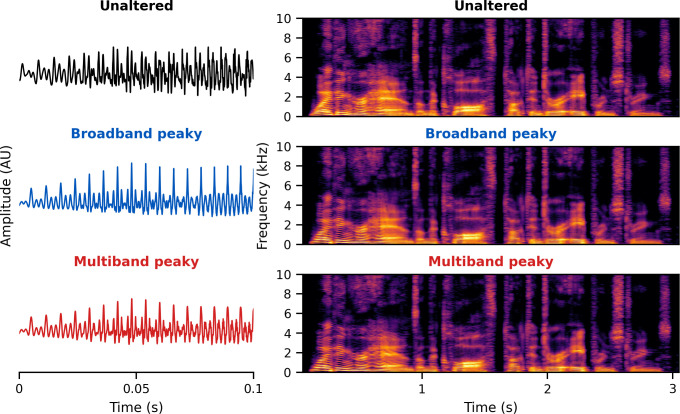
Figure 13. Unaltered speech waveform (top left) and spectrogram (top right) compared to re-synthesized broadband peaky speech (middle left and right) and multiband peaky speech (bottom left and right).
Comparing waveforms shows that the peaky speech is as ‘click-like’ as possible, while comparing the spectrograms shows that the overall spectrotemporal content that defines speech is basically unchanged by the re-synthesis. A naïve listener is unlikely to notice that any modification has been performed, and subjective listening confirms the similarity. Yellow/lighter colors represent larger amplitudes than purple/darker colors in the spectrogram. See supplementary files for audio examples of each stimulus type for both narrators.

