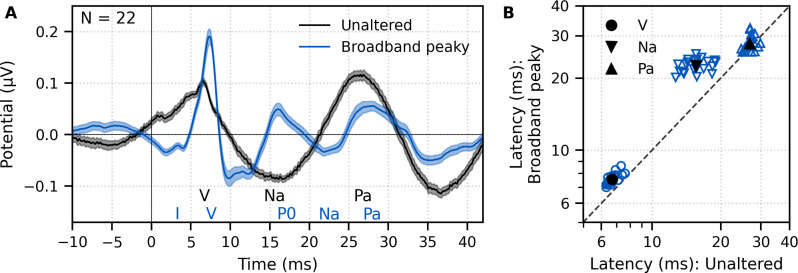
Figure 2. Comparison of auditory brainstem response (ABR) and middle latency response (MLR) to ~43 min each of unaltered speech and broadband peaky speech.
(A) The average waveform to broadband peaky speech (blue) shows additional, and sharper, waves of the canonical ABR and MLR than the broader average waveform to unaltered speech (black). Responses were high-pass filtered at 30 Hz with a first-order Butterworth filter. Areas show ±1 SEM. (B) Comparison of peak latencies for ABR wave V (circles) and MLR waves Na (downward triangles) and Pa (upward triangles) that were common between responses to broadband peaky and unaltered speech. Blue symbols depict individual subjects, and black symbols depict the mean.

