
Figure 3. Comparison of grand average (N = 22) measured and modeled responses to ~43 min of broadband peaky speech.
Amplitudes of the linear (dashed line) and auditory nerve (AN; dotted line) modeled responses were in arbitrary units, and thus scaled to match the amplitude of the measured response (solid line) over the 0–20 ms lags. The pre-stimulus component was present in all three responses using a first-order 30 Hz high-pass Butterworth filter (left column), but was minimized by aggressive high-pass filtering with a second-order 200 Hz high-pass Butterworth filter (right column).

Figure 3—figure supplement 1. Auditory brainstem response (ABR) kernel used for the simple linear deconvolution model.
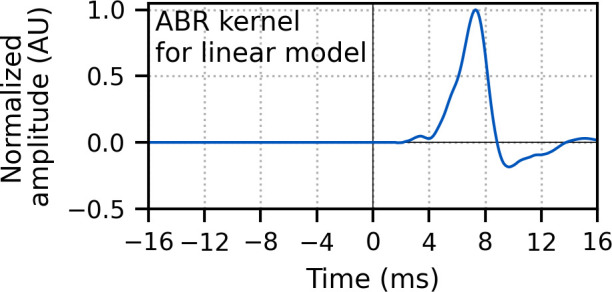
The average broadband peaky speech ABR (N = 22) from 0 to 16 ms was zero-padded from 0 ms to the beginning of wave I (1.6 ms), windowed with a Hann function, normalized, and then zero-padded from −16 ms to 0 ms to center the kernel.