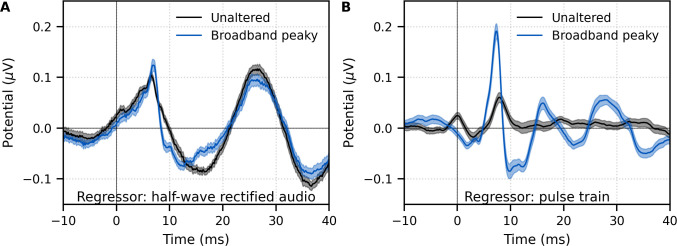
Figure 4. Comparison of responses derived by using the same type of regressor in the deconvolution.
Average waveforms (areas show ±1 SEM) are shown for ~43 min each of unaltered speech (black) and broadband peaky speech (blue). EEG was regressed with the (A) half-wave rectified audio and (B) pulse train. Responses were high-pass filtered at 30 Hz using a first-order Butterworth filter.
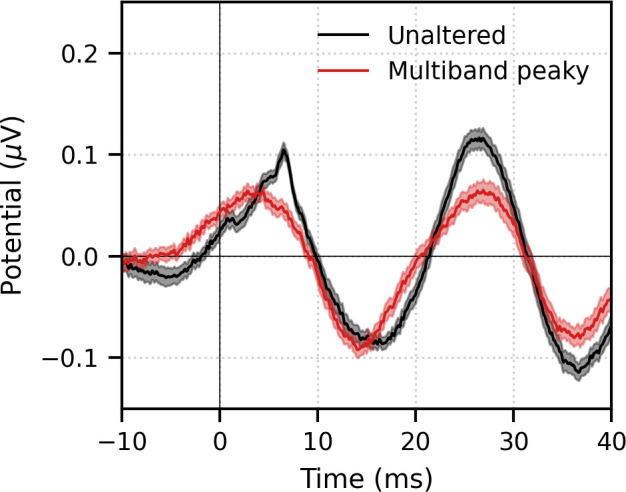
Figure 4—figure supplement 1. Comparison of responses derived by using the half-wave rectified audio as the regressor in the deconvolution with electroencephalography (EEG) recorded in response to ~43 min of unaltered speech and multiband peaky speech.


