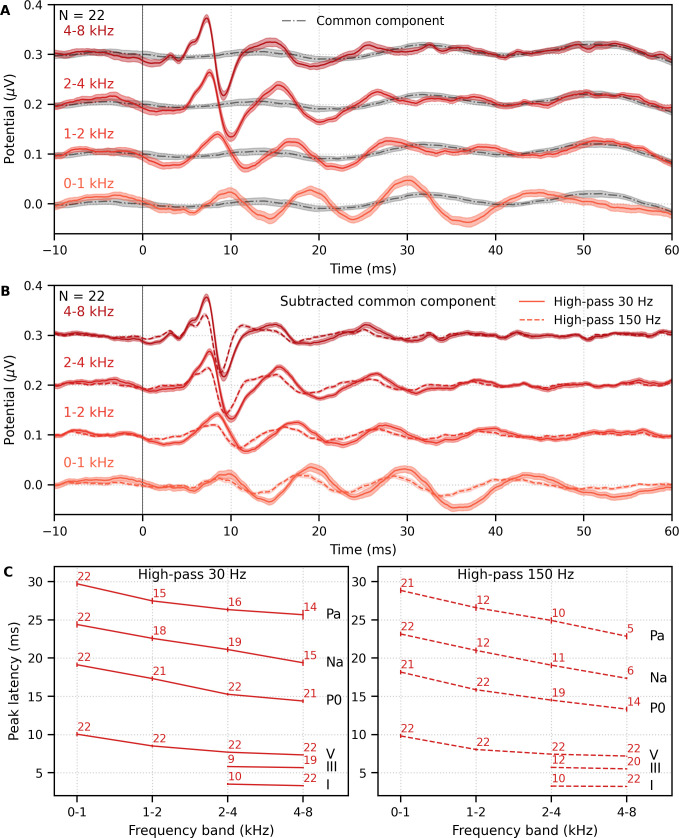
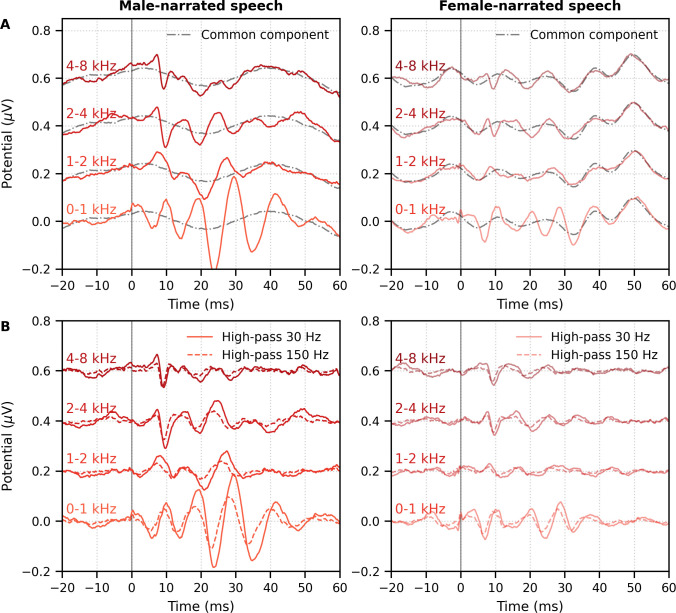
Figure 6. Comparison of responses to ~43 min of male-narrated multiband peaky speech.
(A) Average waveforms across subjects (areas show ±1 SEM) are shown for each band (colored solid lines) and common component (dot-dash gray line, same waveform replicated as a reference for each band), which was calculated using six false pulse trains. (B) The common component was subtracted from each band’s response to give the frequency-specific waveforms (areas show ±1 SEM), which are shown with high-pass filtering at 30 Hz (solid lines) and 150 Hz (dashed lines). (C) Mean ± SEM peak latencies for each wave decreased with increasing band frequency. Numbers of subjects with an identifiable wave are given for each wave and band. Details of the mixed effects models for (C) are provided in Supplementary file 1A.


